Do wishlists on Steam go stale? — perelesoq examines the situation in detail and with examples
Not long ago, an article appeared on the HowToMarketAGame portal, which claimed that wishlists supposedly "do not get old," meaning their value and likelihood of turning into sales do not decrease over time. The perelesoq team decided to investigate this assertion by analyzing real data from five different games: Torn Away, CyberCorp, Elixir, Selfloss, and Tavern Manager Simulator (they also included data from Furnish Master).

This material was first published in the Telegram channel of the "Game Marketing" team. With the kind permission of the team, we are publishing it on our pages.

Artem Koblov, founder and creative director of the studio perelesoq
A huge thank you to the developers for sharing their data. Without you, this material wouldn't exist!
Repeating the Old Trick
First, we replicated HowToMarketAGame's method and constructed a linear regression for conversion rates of wishlists for these five games.
But first, a bit of theory.
To understand exactly how wishlist conversion changes over time, we used a method of data approximation. Initially, we gathered a set of points—these are the conversion values by month (for example, what percentage of people who wished for the game in September ended up buying it). Then we attempted to fit a mathematical curve that most accurately describes the behavior of these points.
The principle is simple: we choose the shape of the line (e.g., a straight line, a parabola, or a cubic curve) and automatically adjust its parameters so that the average deviation from the actual points is minimized. This is known as error minimization.
- If we choose a straight line—this is linear regression (1st order).
- If a parabola—quadratic (2nd order).
- If a curved line with two bends—a cubic regression (3rd order), which is especially well-suited when data behaves erratically: first a decline, then growth, then decline again.
On the graphs:
- Green dashed lines indicate where the model underestimated the value, placing the point above the line.
- Red dashed lines indicate the model overestimated the value, placing the point below the line.
The metric R² (coefficient of determination)—a metric showing how well the mathematical model explains the behavior of the data. It measures from 0 to 1, where:
- R² = 1 means the model perfectly explains the changes in data (all points lie precisely on the trend line);
- R² = 0 means the model does not explain the data at all (the trend line does not reflect the dependency between the variables).
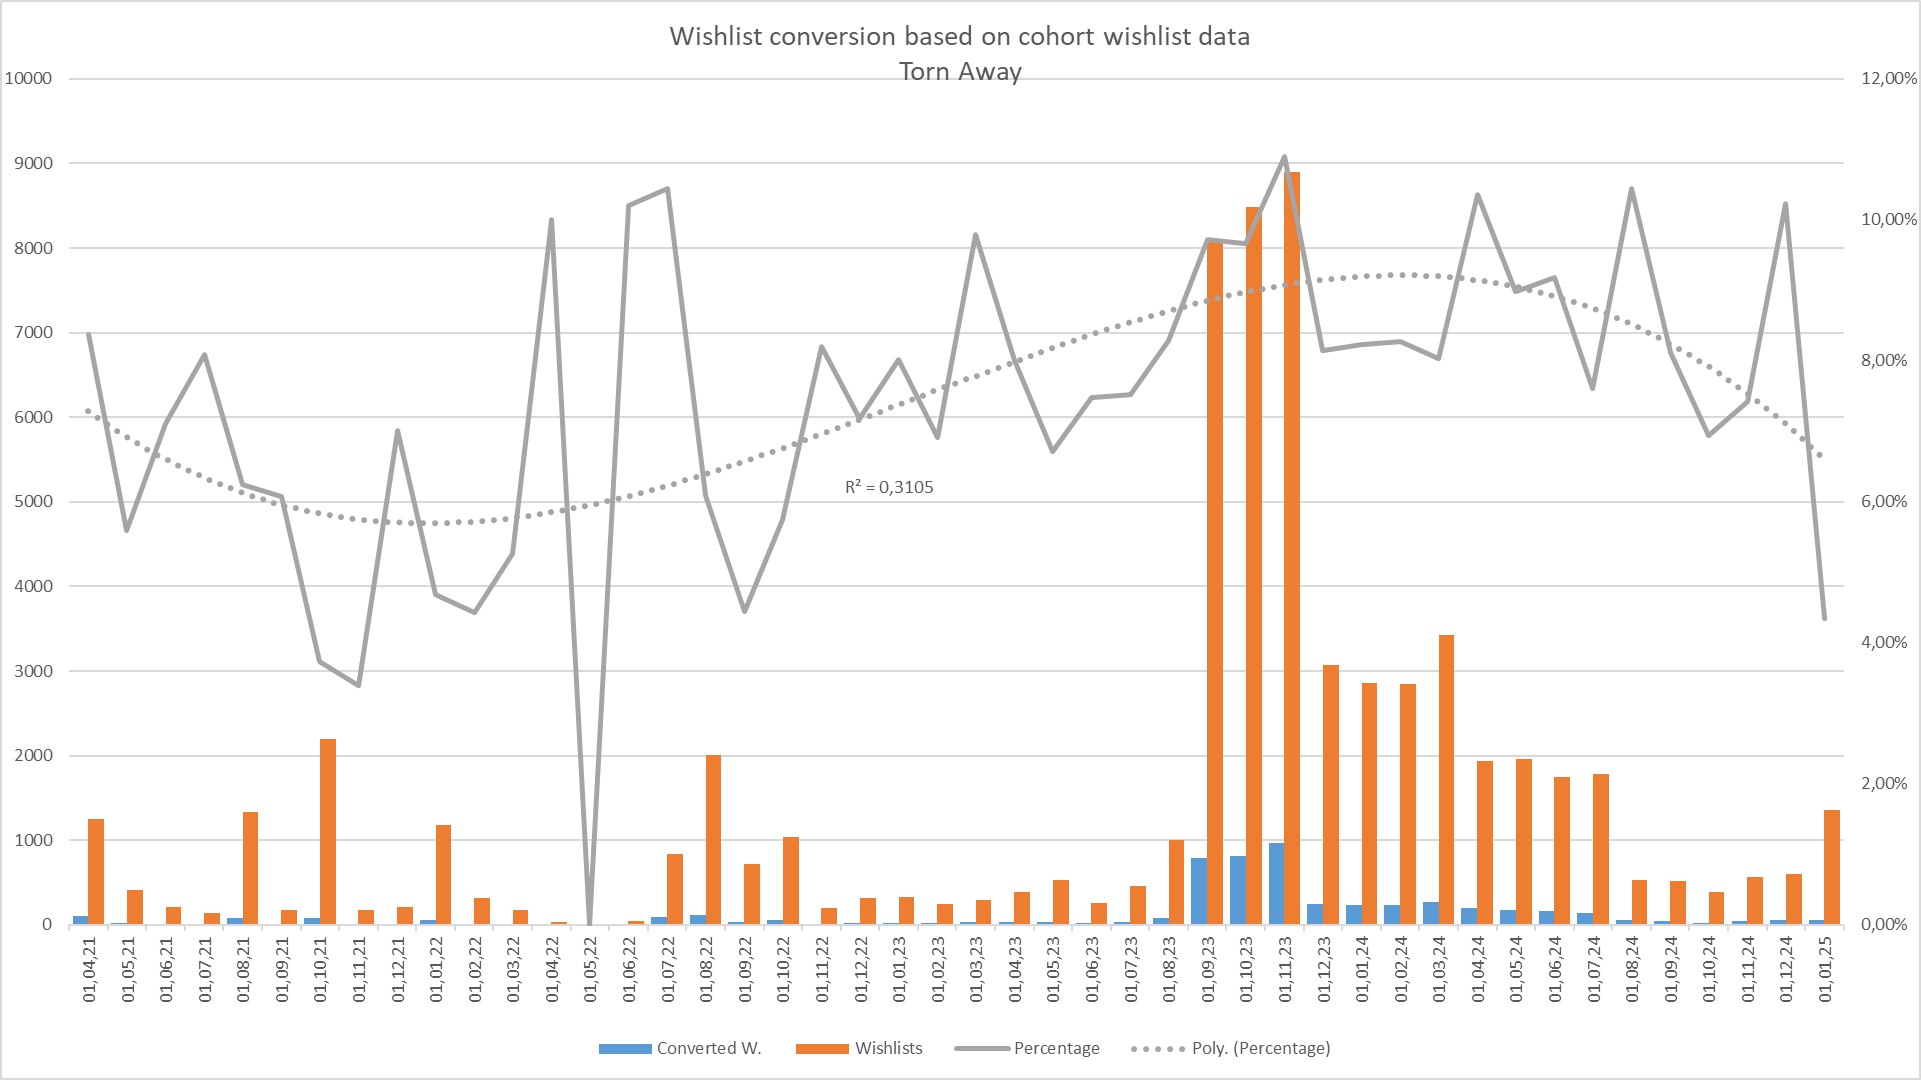
Torn Away
Linear regression of conversion starts from 6% for the oldest wishlists, to 9% for the newest.
R²=0.1665

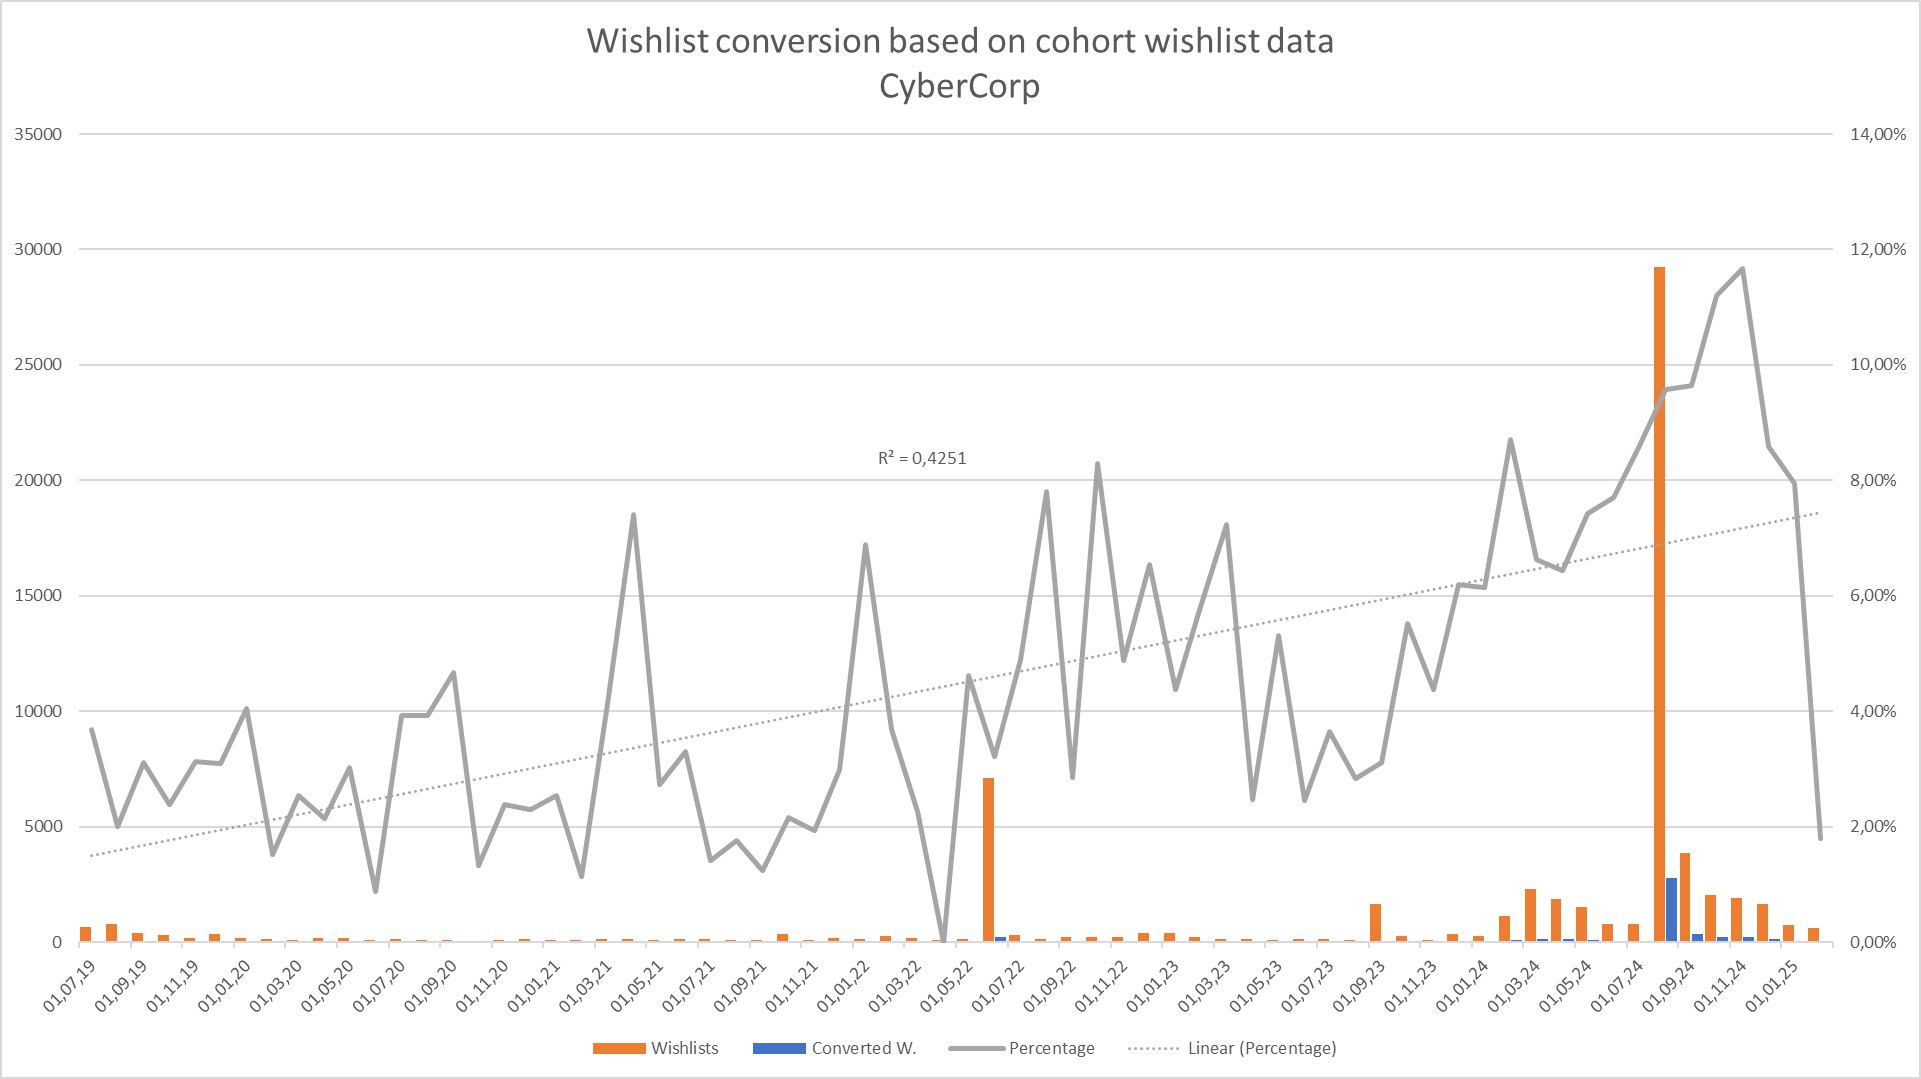
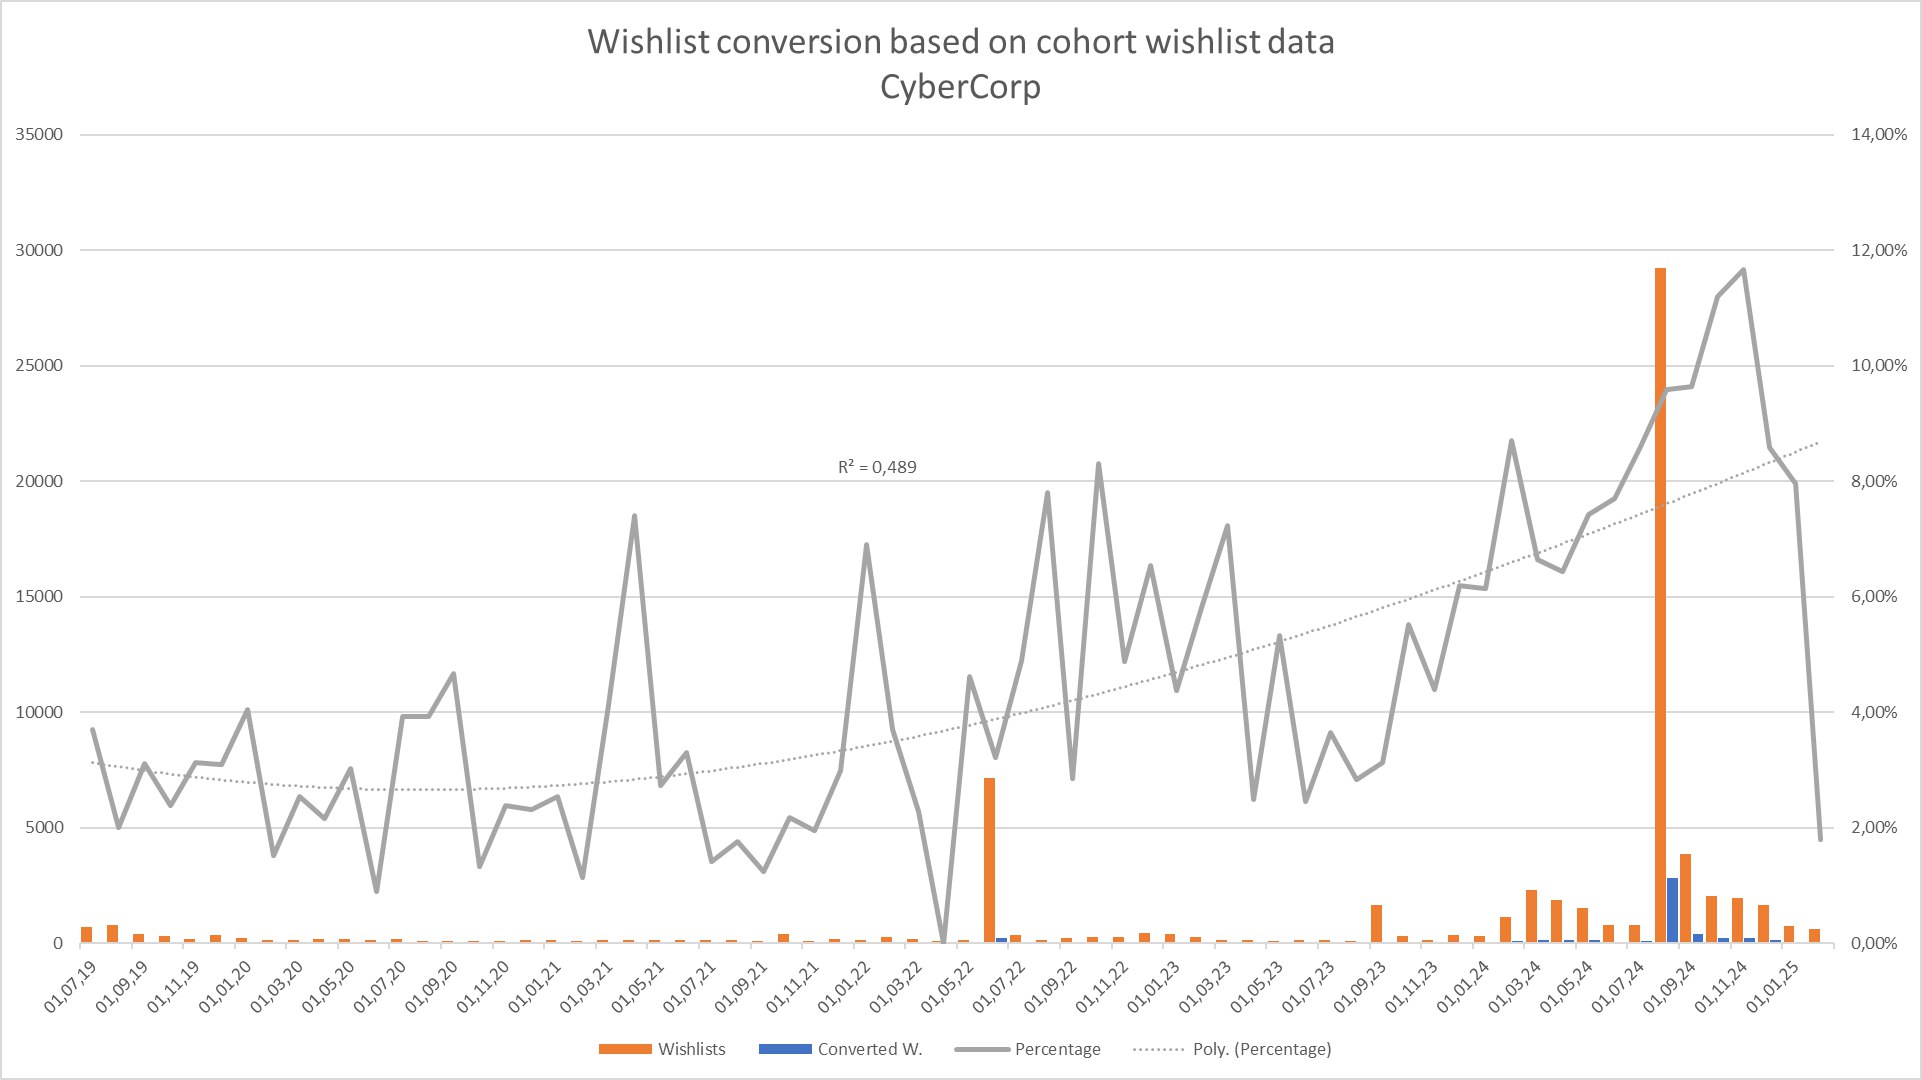
CyberCorp
From 2% for older wishlists to 8% for those appearing closer to release.
R²=0.4251
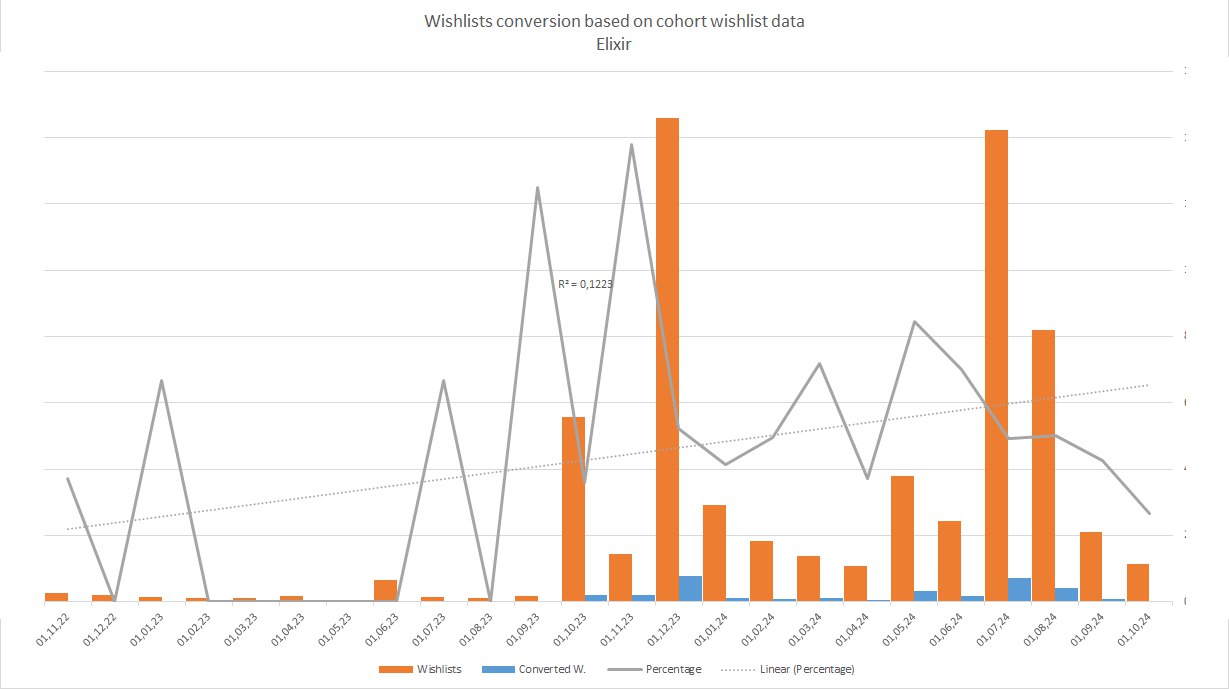
Elixir
Conversion from 2% old to 6% new.
R²=0.1223
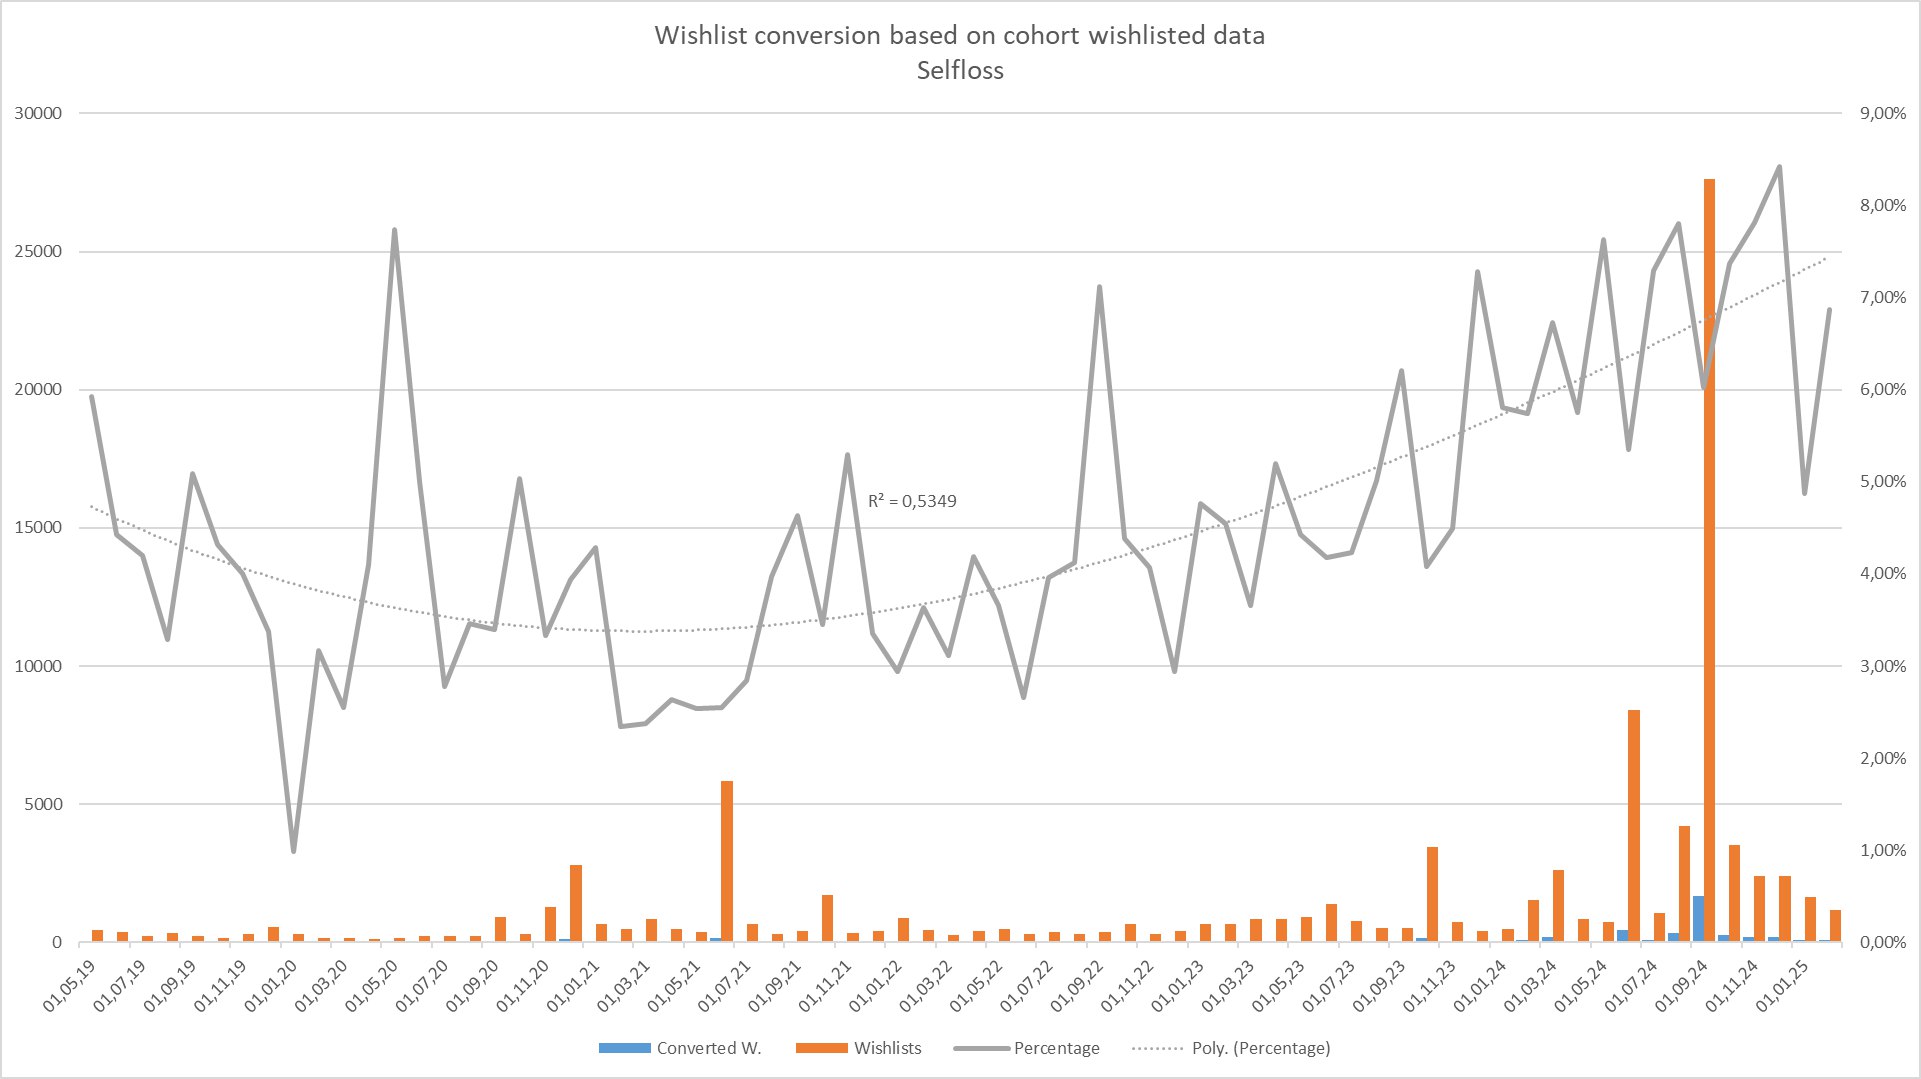
Selfloss
Conversion from 3% old to 6% new.
R²=0.33

Tavern Manager Simulator
This game was the sole exception. On its graph, linear regression showed a reverse trend: from 21% old to 19% new, with extremely low model accuracy.
R²=0.0205
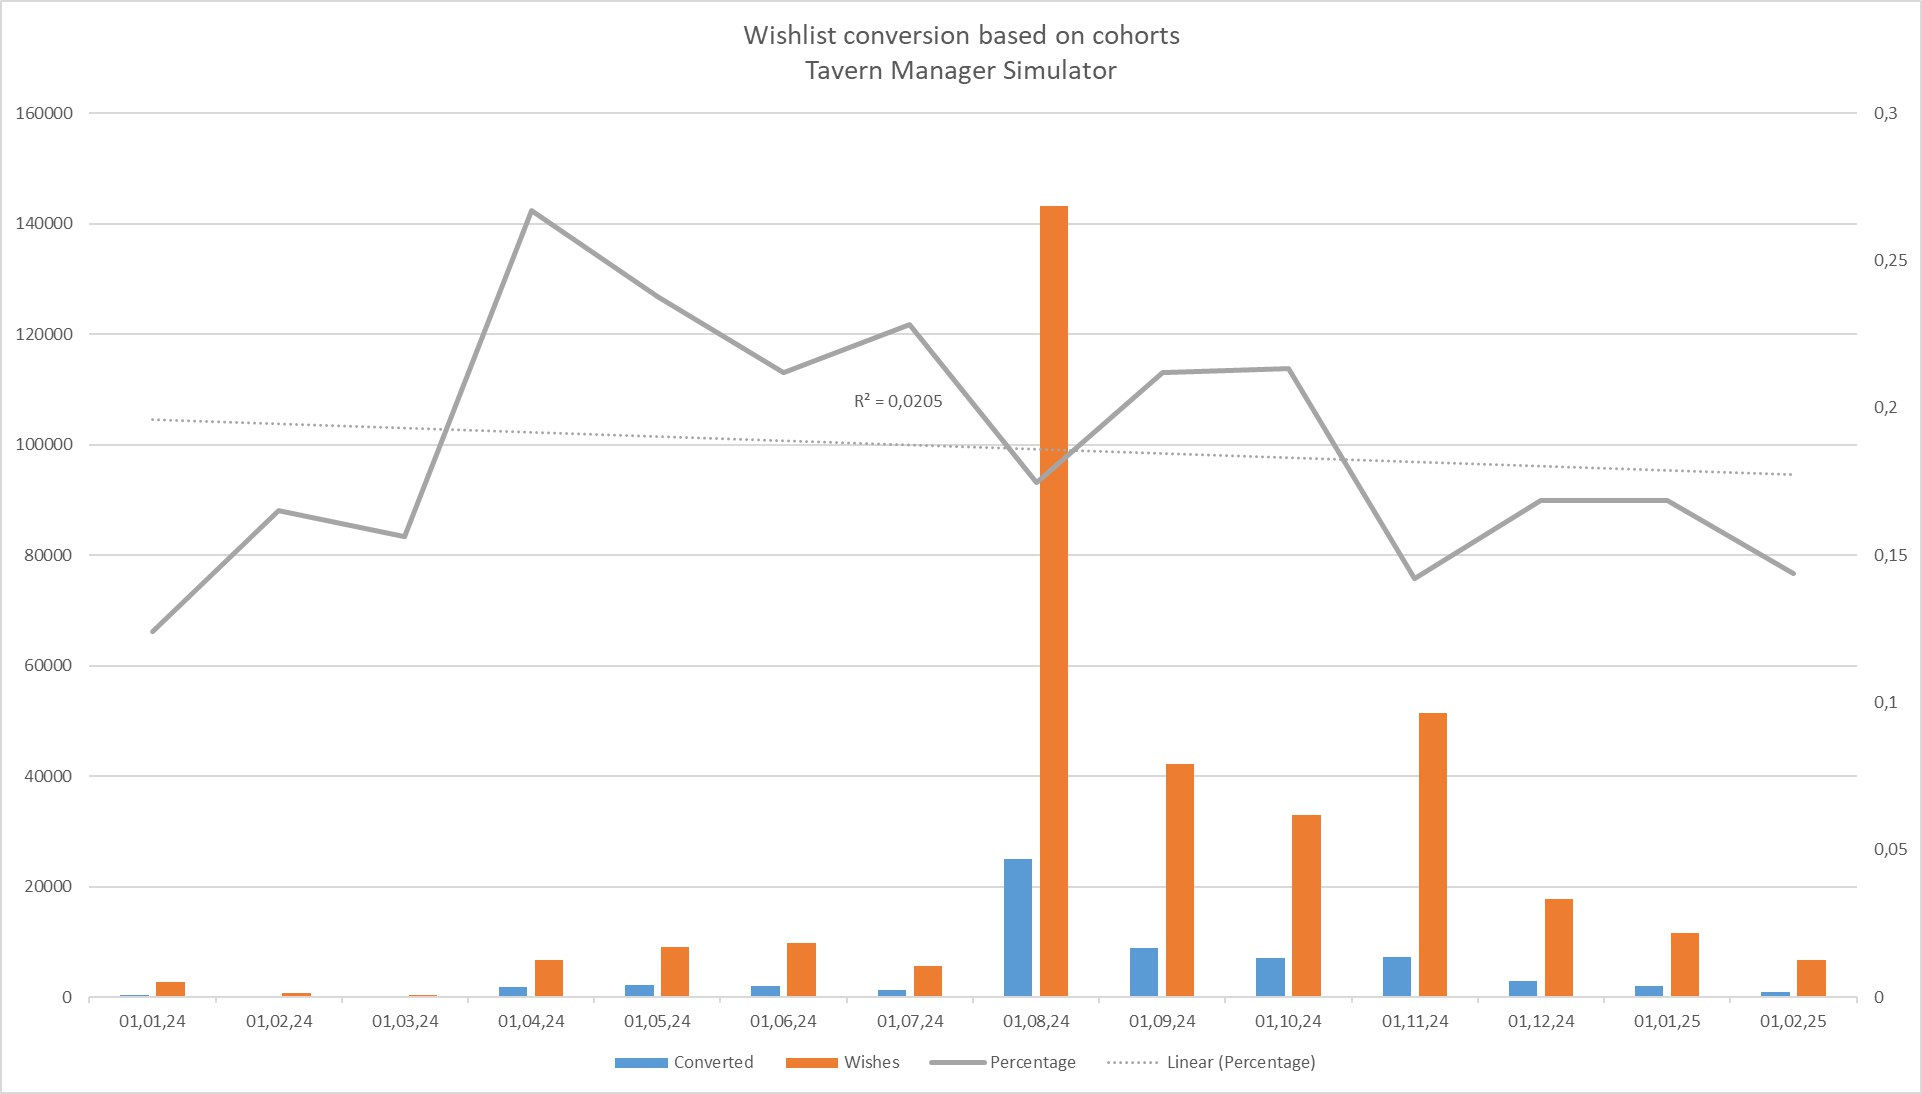
The case of Tavern Manager Simulator is also unique in that only about six months passed from announcement to release, unlike other projects that took on average 2-3 years to gather.
At first glance, HowToMarketAGame's method might seem valid. However, low accuracy scores (R²) suggest otherwise—the linear model simply poorly describes the dynamics of wishlist conversion. Even visually, the graph appears more like a curve with rises and dips rather than a flat line.
Additionally, even when working with linear regression, we see a clear trend showing that conversion for later wishlists is significantly higher than earlier ones.
Using the Cubic Regression Method
Realizing that linear dependency poorly describes conversion, we used a more precise tool—cubic regression. This method allows us to see a more complex picture: the rises and falls in interest occurring before and after the release.
Torn Away
Cubic regression accuracy R²=0.31. This is almost twice as high as the linear.
CyberCorp
For this game, accuracy increased even further.
R²=0.489
Elixir
The accuracy is nearly three times higher than linear regression.
R²=0.29

Selfloss
Again, the accuracy is nearly double that of linear regression.
R²=0.53
Tavern Manager Simulator
Now the case does not stand out from the general picture.
R²=0.64

These results clearly show: the conversion dynamic is far more complex than a simple linear dependence.
Increasing the order of the curve (three bends, four bends, five bends) has little impact on improving accuracy—cubic is the optimum between precision and "comprehensibility" for perception.
Incidentally, the developer of Furnish Master also shared his data. In his case, older wishlists also demonstrate significantly lower conversion than newer ones. You can explore the detailed findings here.
What Does This Mean in Practice?
From the data obtained, several important conclusions can be drawn.
1. Wishlists Do Get Old
Older wishlists (those that users added long ago, months or years before release) have a noticeably lower likelihood of turning into sales compared to newer ones. The closer the release date, the higher the probability that a user will actually purchase the game.
2. It's Not the Quantity of Wishlists, But Their Dynamics
100,000 wishlists gathered quickly before release are much more valuable and effective than the same 100,000 wishlists collected over a year or more.
A short and intense growth before release can lead to actual success and create the kind of virality and "hype" around the product that translates into sales.
3. The First and Last Wishlists Are the Most Valuable
We discovered an interesting effect: the conversion of wishlists added immediately after the Steam page launch is noticeably higher than those garnered during the "calm period" in the middle of the cycle. Perhaps the audience that first learned about the game without active marketing inherently has a higher interest and intent to buy.
4. "Blind Wishlist Accumulation" Is an Ineffective Strategy
This calls into question the usual approach of "opening the page as early as possible and gradually accumulating wishlists." Our data suggests such a strategy does not yield significant results. It is better to focus efforts closer to release and the post-release period, where the most active and ready-to-pay audience is located.
5. The Main Thing Is Sales, Not Wishlists
In the gaming industry, there is often a "race for wishlists," but it is far more important to remember that real money comes from sales.
Our data showed a key difference between successful and less successful games, which is crucial to recognize:
- for less successful projects (e.g., Torn Away, Selfloss, and Elixir), a large portion of post-release sales came from those players who had previously wished for the game. Although this sounds logical, such dynamics in reality is a troubling signal. This means the game is selling almost exclusively to the "old" audience, attracted in advance, while a new audience after release does not come in sufficient numbers;
- meanwhile, in the more successful example—Tavern Manager Simulator—the situation is the opposite. There, sales from wishlists account for a relatively small portion of total sales. A significant share of sales is made to a new audience coming after release, rather than those who preemptively added the game to their wishlist. We will further explore the reasons behind this player behavior.