Multi-faceted Android
Staircase3 has found out which smartphone is the most popular among Android devices, on which devices it is best to test your own applications, and also why the fragmentation of the “green” platform is growing from year to year.
Let’s start from afar. About a year ago, Staircase3 released a free application for Android – Open Signal Maps (OSM), designed to “improve the quality of reception of mobile and Wi-fi signals.” Strictly speaking, its essence was initially reduced to demonstrating the signal strength, the number of towers and the number of Wi-Fi routers on the map of the selected area. So there is nothing surprising in the fact that at the moment, according to Google Play statistics, the number of OSM installations now ranges from 1 to 5 million.
Six months ago, the developers of the application began monitoring devices on which OSM was installed. Information was collected about the model, brand, Android version and screen size of the device. Actually, this information was shared by the developers the other day.
Devices and brands
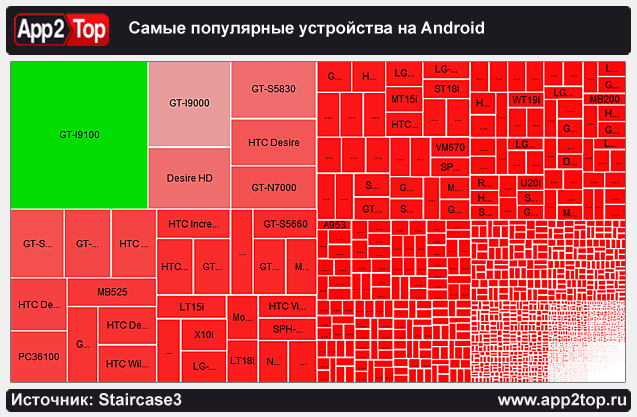
As a result of the study, about 682 thousand downloads made from 3997 different devices were processed. It’s funny – 1363 of them are unique. Such a variety of models is partly explained by the fact that the user can rewrite the android variable.build.MODEL, which is used to identify the device model.
Anyway, the most popular Android device turned out to be Samsung Galaxy II (GT-I9100) – more than 61 thousand OSM installations were made from it. In second place is its predecessor – Samsung Galaxy. As for the honorable third place, HTC Desire HD has it.
The situation with brands is similar. The absolute winner is Samsung with 270 thousand devices. This is a good 40% of all “investigated devices”. HTC is in second place, almost on an equal footing with Sony Ericsson and Motorola.
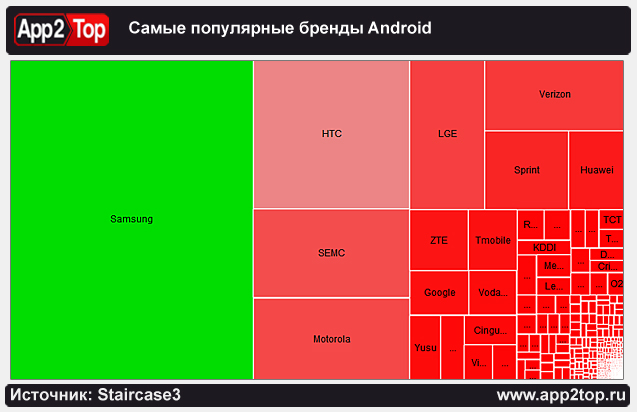
So, based on these figures, we can safely recommend testing applications, first of all, on the most popular Samsung devices (pay special attention to the Galaxy family) and HTC.
Android Versions
As for fragmentation by Android versions (by API level), there is a whole story here. The fact is that according to the data obtained by Staircase3, the situation with her has noticeably worsened over the year. Which, in principle, is quite expected, given the release of its new versions. Conditionally “popular” APIs are now not six, as it was last April, but ten. Moreover, if a year ago the two most popular versions covered 90% of the market, then this is only 75%. A test for the developer!
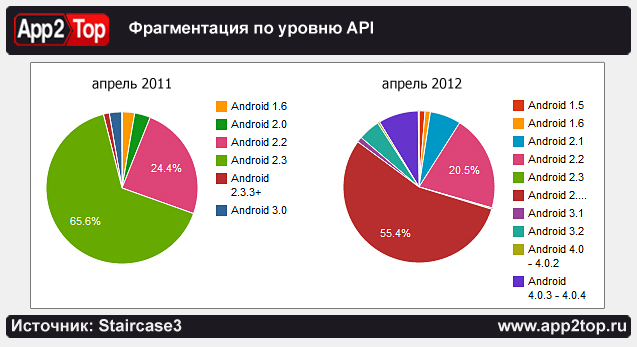
The only good news is that the leaders are the same: Android 2.3.3 (a slightly modified version of Gingebread, which occupied 65.6% last year) with 55.4% and Android 2.2 with 20.5% (last year its share was 24.4%).
Permission
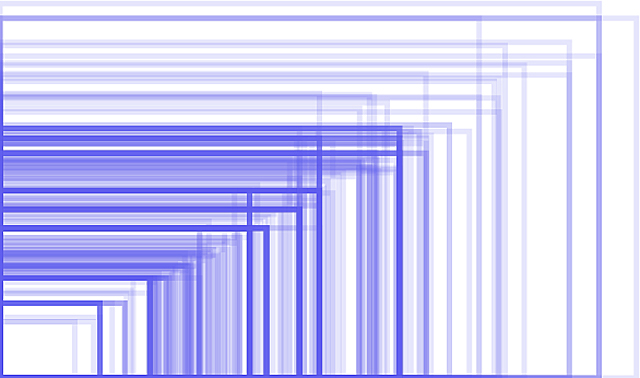
Another problem that the researchers have deduced is the lack of a standard in permissions. Even one vendor can market devices with different screen resolutions, different diagonals and aspect ratios.
Below is a very revealing picture on the topic “what are the Android resolutions”.
And, for comparison, what are the iOS permissions.

By the way, Staircase3 data came from 195 countries. Moreover, as it turned out, the OSM application was in the greatest demand in the USA, Brazil, China, Russia and Mexico.
Instead of a conclusion
The Android smartphone market is actively growing. There are more and more new devices with new resolutions, new screen diagonals, original firmware and interfaces. All this further complicates the work of a developer who has ventured into Android. But, on the other hand, this growth opens the way to new users.