A benchmark for mobile game metrics from GameAnalytics has been released
After launching their own game, developers often worry about the question: what kind of retention is considered good, how much time users usually spend in similar projects, what kind of ARPPU competitors have? The new GameAnalytics report, which was first available at White Nights in St. Petersburg, removes such questions.

The main thing is brief:
- for top projects, the retention of the 1st day is from 40% and above;
- the highest retention of the 1st day is shown by quizzes (up to 48%);
- the retention of the 7th day is considered good if it is 14%;
- the leaders in retention of the 7th day are card games, social casinos, quizzes and word games (20% and above);
- for top projects, the retention of the 28th day is 5-7%;
- the highest retention is shown by table games, card games, social casinos, puzzles and word games (10% and above);
- top games have an average session length of 11-14 minutes.;
- leaders in average session length — card games and social casinos (more than 25 minutes);
- the stickiness of top projects is usually 18-20%;
- leaders in stickiness — table games, card games, social casinos, puzzles and word games (above 20%);
- ARPPU from market leaders — $20-25;
- the biggest ARPPU in action movies, card games, role-playing games and strategies;
- ARPDAU for top projects is $0.10-0.14;
- The highest ARPDAU is found in role-playing games and strategies;
- the top 15% of games have a conversion rate of 0.8-1.2%;
- role-playing games and strategies have the highest conversion to a paying player (2-3%).
Further — in detail.
Retention of the 1st day
This metric reflects what percentage of users came to the game the day after the first session.
The retention rate of the 1st day is considered excellent if it is 40% or higher. Very few people on the market can boast of such a retension.
The median retention value of the 1st day is about 25%. However, GameAnalytics clarifies that many studios today close projects if the retention of the 1st day is less than 35%.
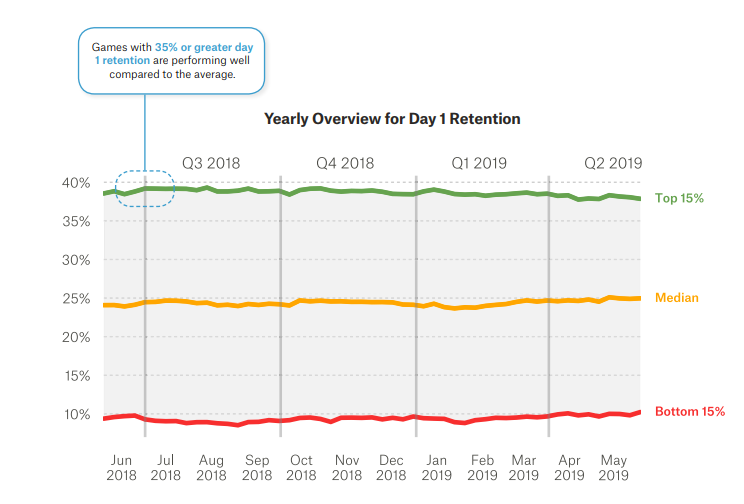
The annual dynamics of retention of the 1st day (funny, 35%, although it serves as a reason for closing projects, but in general, this is a very good indicator for the market)
Within each genre, the retention range of the 1st day varies greatly from project to project. However, on average, children’s games (Kids category) are the worst in the market. Even top projects cannot boast of a 1st day retention above 25%.
The best median retention of the 1st day in the market is demonstrated by word games — it almost reaches 35%. However, the record retention rates of the 1st day are for quizzes (Trivia). For hits in this genre, the retention of the 1st day can reach up to 48%.
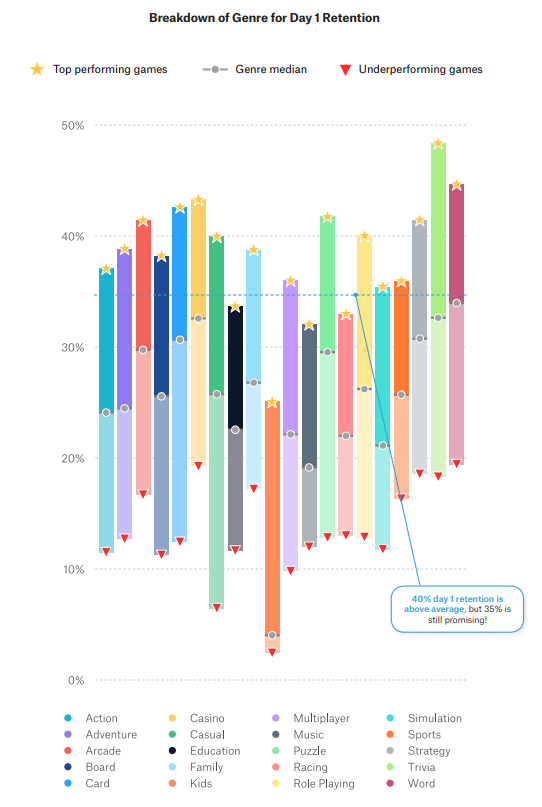
Retention of the 1st day by genre
Retention of the 7th day
This metric reflects the percentage of users who returned to the game a week after the first game session.
According to the market, according to GameAnalytics, 14% is considered a good indicator of retention on the 7th day. Only in the top 15% of games, the metric achieves such results.
The median retention value of the 7th day is 5%.
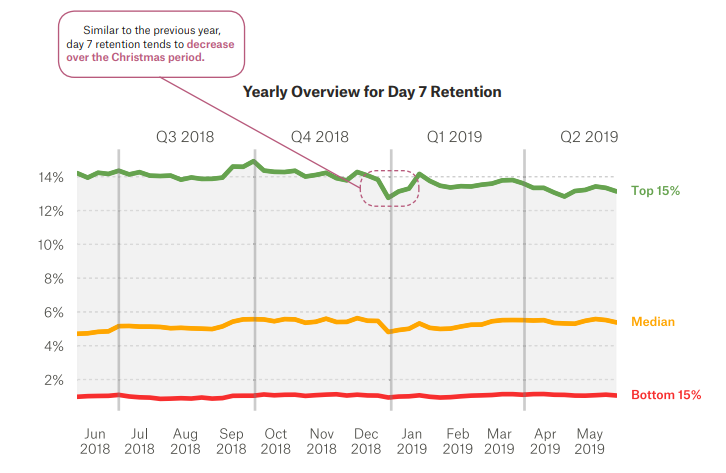
Annual retention dynamics of the 7th day (the drop in retention in the center of the chart is associated with Christmas)
Top projects of few genres fall within the retention range of the 7th day of 15-25%. These include: table titles (Board), card games (Card), social casinos (Casino), games for the whole family (Family), puzzles (Puzzle), strategies (Strategy), quizzes and word games.
Even the top games in the genre of racing, as well as music and children’s games, do not gain 10% retention on the 7th day.
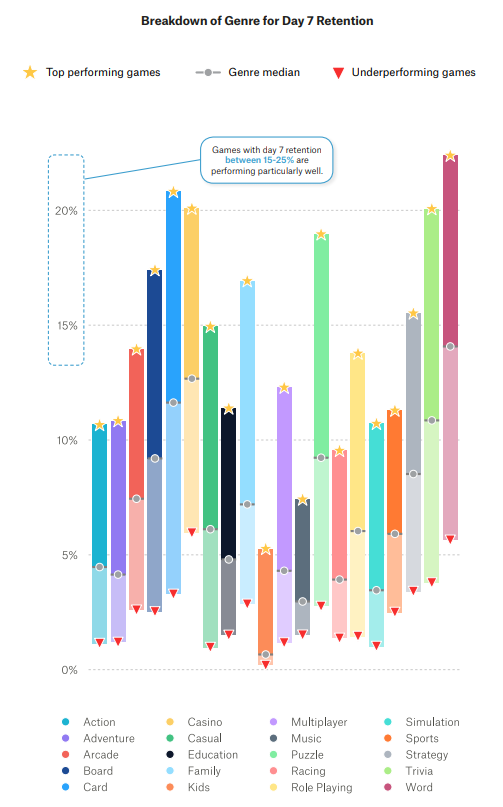
Retention of the 7th day by genre
Retention of the 28th day
The indicator reflects what percentage of users came to the game a month after the first session.
The top 15% of games can boast of a 5-6% retention on the 28th day. At the same time, in 2019, he fell among the leaders. Analysts attribute this to the fact that players started leaving games earlier.
The median retention value of the 28th day is around 1-1.5%.
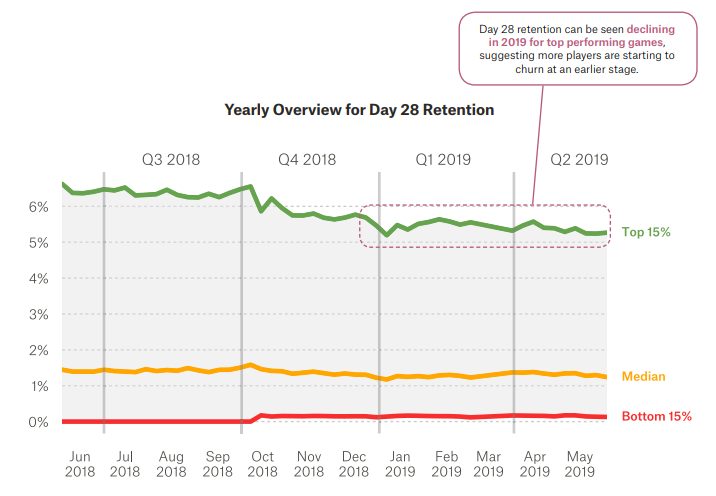
The annual retention dynamics of the 28th day (the drop in retention for top games in the second half of the chart means that users are now dropping games at earlier stages than before)
Top games of most genres cannot overcome the bar of 10%. However, hits in such categories as table games, card games, social casinos, puzzles and word projects are capable of this.
At the same time, GameAnalytics notes that those games whose retention on the 28th day is 6% or more are usually doing great.
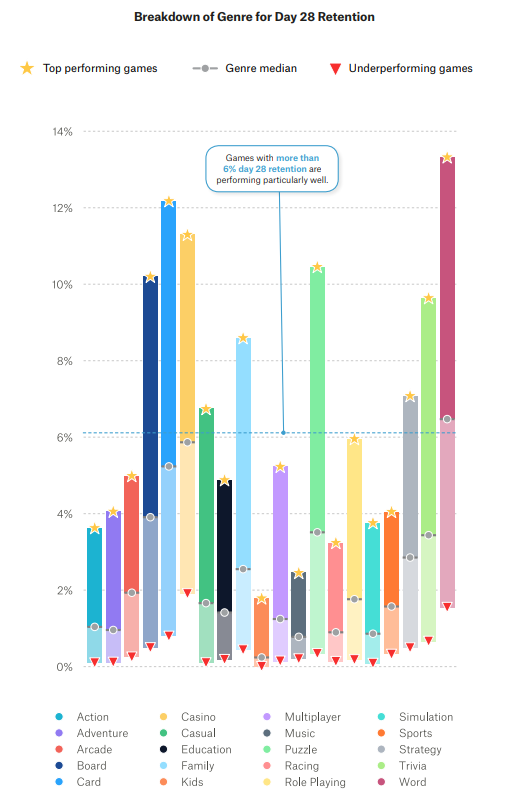
Retention of the 28th day by genre
Average session length
By this metric, analysts understand the time from the launch of the application to the moment when it is sent to the background.
Important: a short game session is not necessarily bad, but a large one is on the contrary, not necessarily good. But under generally equal conditions (genre, visual style, mechanics used), the high duration of the game session indicates the fascination of the game.
Only 15% of projects on the market have an average session of 11-12 minutes. And it falls from month to month. Back in June 2018, this parameter was about 14 minutes.
The median value of the average gaming session is 5-5.5 minutes. And it’s falling too.
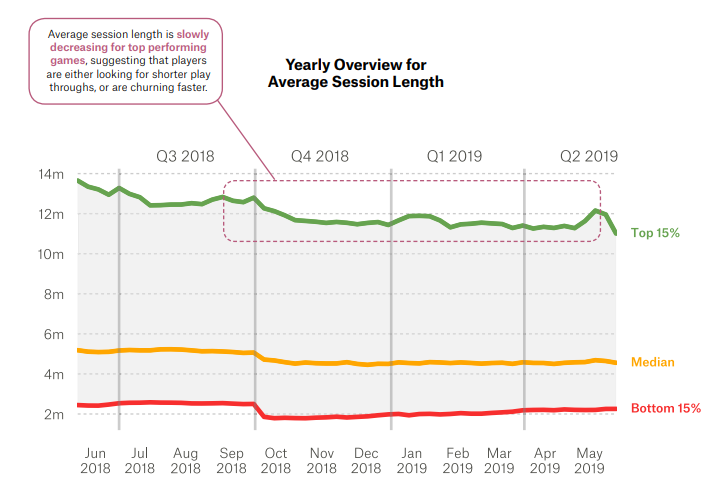
The annual dynamics of the length of the average session (the negative nature of the dynamics suggests either that players now tend to play less, or “fall off” faster)
Among all genres, two are distinguished by the duration of the session — card games and casinos. In the top games of these genres, users spend an average of 25-35 minutes.
Multiplayer games also show good indicators. In general, they have the highest median among all genres — 10 minutes, and top games have an average session duration of 22-23 minutes.
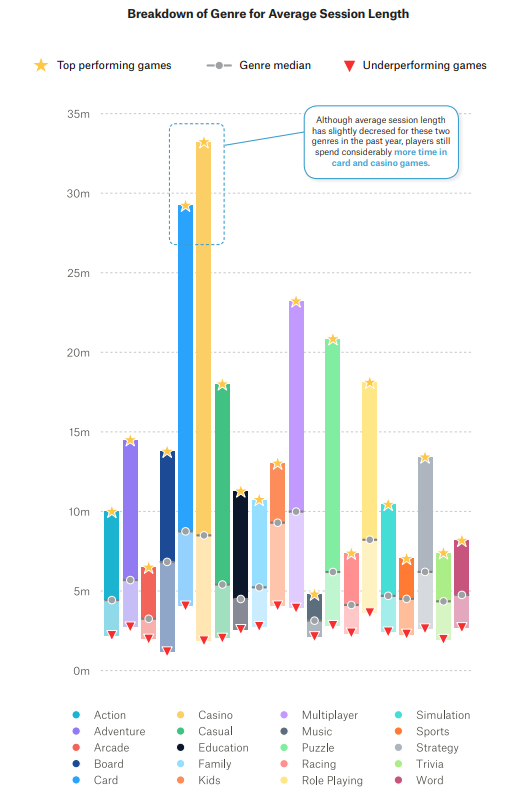
The length of the average session by genre (despite the fact that the length of the average session for cards and social casinos has fallen over the past year, these genres remain leaders in this metric)
Stickiness
The metric reflects how many monthly users play the project every day. It is calculated by dividing DAU by MAU and multiplying by 100%.
The stickiness of the top 15% of games on the market is about 19%. GameAnalytics notes that if the game has a stickiness of 18%, this in itself is very good.
The median stickiness value on the market is about 8%.
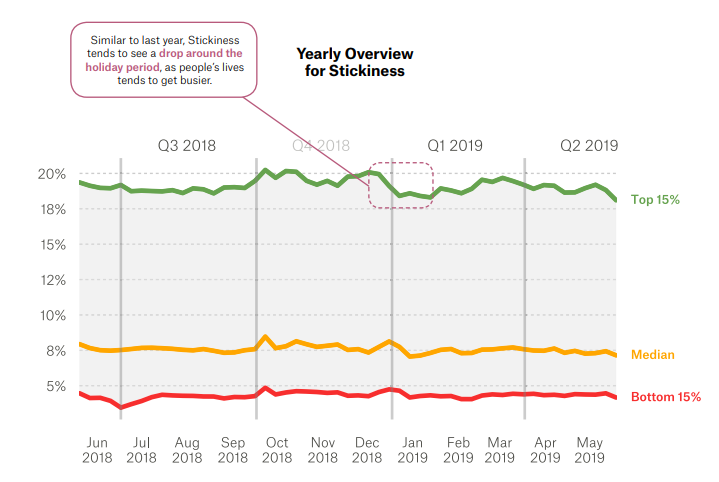
Annual stickiness dynamics (similar to last year, there is a significant drop in stickiness during the Christmas period)
The best stickiness on the market is shown by games in the genre of social cinema. The median index of average stickiness in this genre is above 20%. The stickiness of top games in this direction can reach almost 30%.
Card games also show very good stickiness. Their stickiness range is from 8% to 28%.
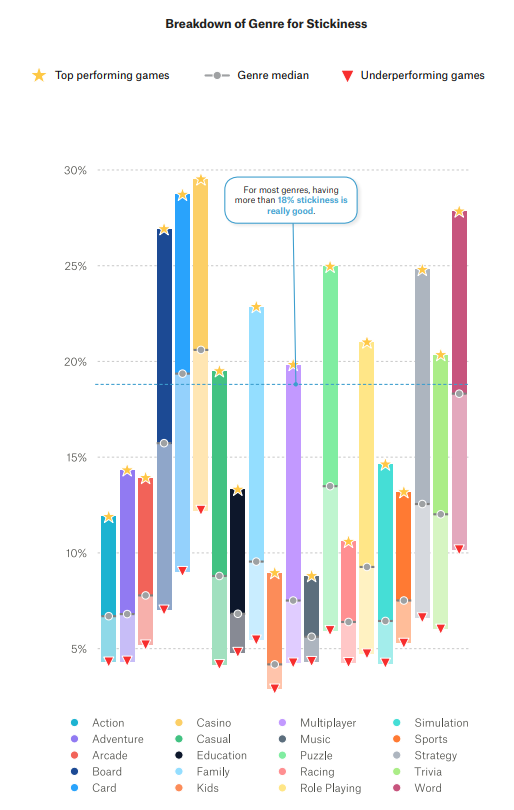
Stickiness by genre
ARPPU
Recall that ARPPU is the average income per paying user. As part of this study, GameAnalytics took into account only direct payments in games. Revenue from advertising was not taken into account.
In the top 15% of games, ARPPU is about $20. However, this metric for leading projects varies greatly depending on the season. It falls by the Christmas season, and then recovers until the third quarter inclusive. This is easily explained: the paying audience increases during the holidays. New users can, on average, pay much less than the main paying audience of the game.
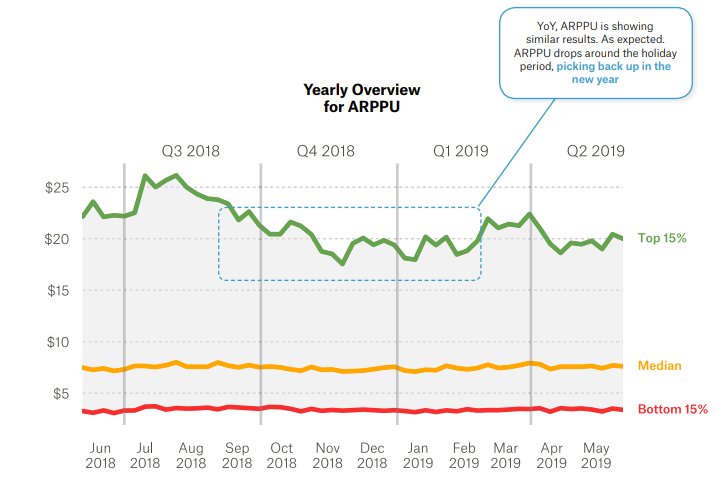
Annual dynamics of ARPPU (the indicator for top games drops by Christmas, then increases)
The biggest ARPPU is in action games (Action), strategy and role-playing (RPG) games. They have it at $27-31.
However, the best median value for multiplayer games is around $15.
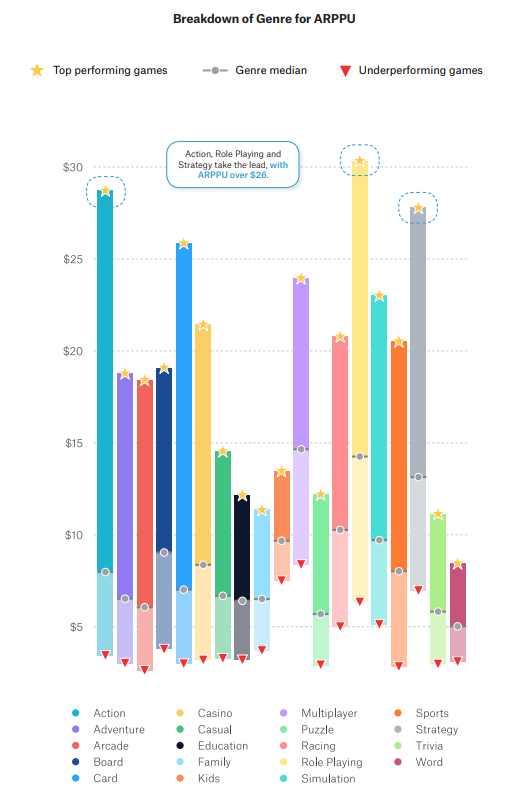
ARPPU by genre
ARPDAU
This metric reflects how much the game earns on average per user per day.
In the top 15% of games, as a rule, ARPDAU ranges from $0.10 to $0.14.
The median value is quite insignificant — $0.02.
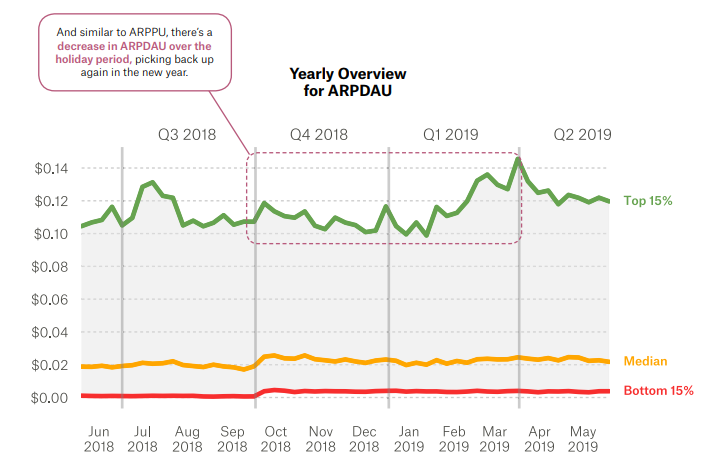
Annual dynamics of ARPDAU (as in the case of ARPPU, ARPDAU falls for top products by Christmas, and then recovers)
The maximum ARPDAU is shown by strategies and role-playing games. For the latter, the metric value can reach up to $ 0.25.
Card games and simulators also demonstrate a high level of ARPDAU — up to $ 0.15.
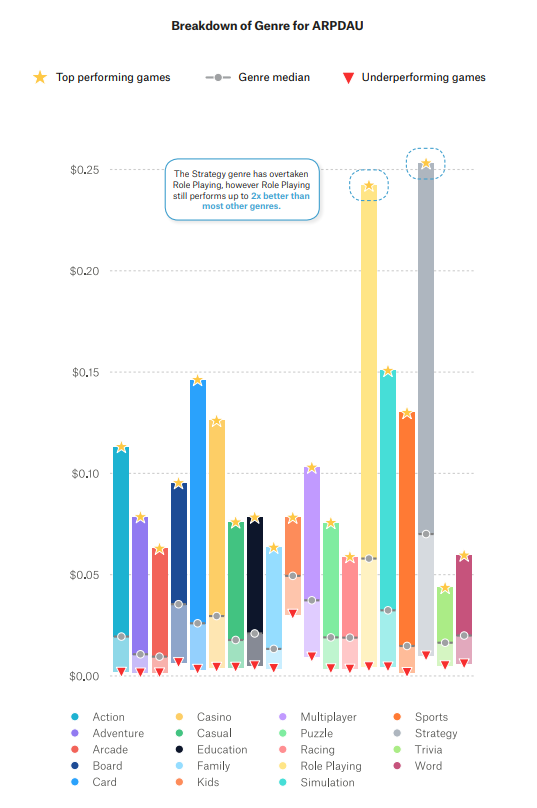
ARPDAU by genre (this indicator for role-playing games is on average 2 times higher than for most games of other genres)
Conversion
This metric reflects the percentage of users who made a purchase on a particular day.
A year ago, the conversion rate of the top 15% of games could reach 1.2%, but by May 2019 it had fallen to 0.8%. Analysts explain this by the fact that developers are now paying more and more attention to the monetization of games through advertising.
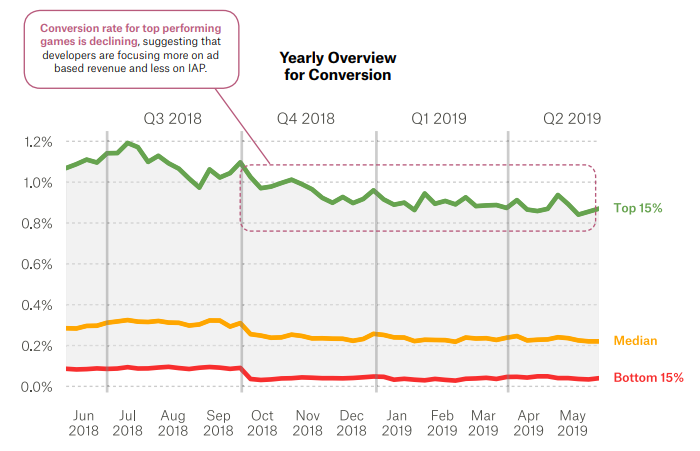
Annual conversion dynamics
In the market as a whole, even top projects in almost all genres rarely show a conversion rate that is more than 1%. There are only two exceptions to this rule — role-playing games, whose leading games show a conversion rate of 3%, and strategies, whose conversion rate can reach up to 2.5%.
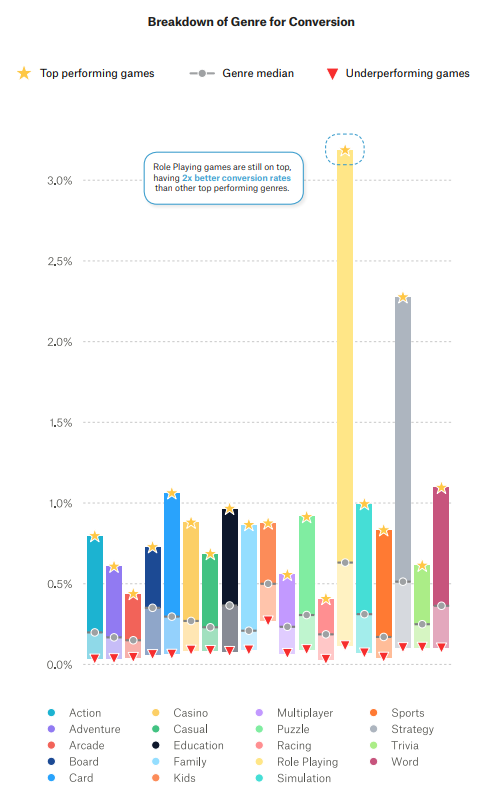
Conversion by genre
Methodology
The data was obtained as a result of the analysis of events in 75 thousand games installed on 3 billion devices. The study period is from June 1, 2018 to May 31, 2019.