Medialets: advertising in apps is twice as effective as advertising on the mobile web
Marketing company Medialets has prepared a large-scale review of the mobile advertising market, from which you can find out which banners have the highest CTR, which inventory sources, on average, have the best CTR, as well as which types of sites have the least high-quality traffic.
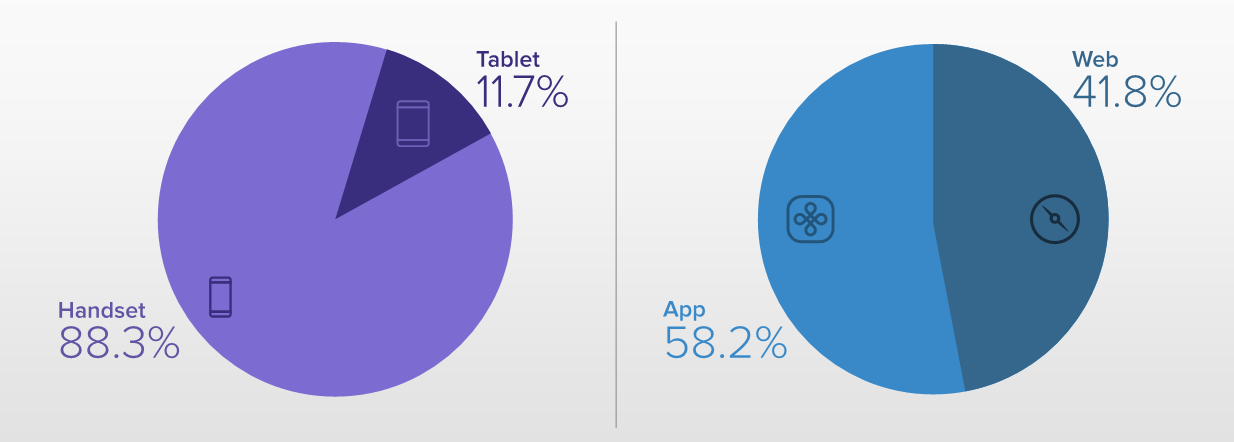
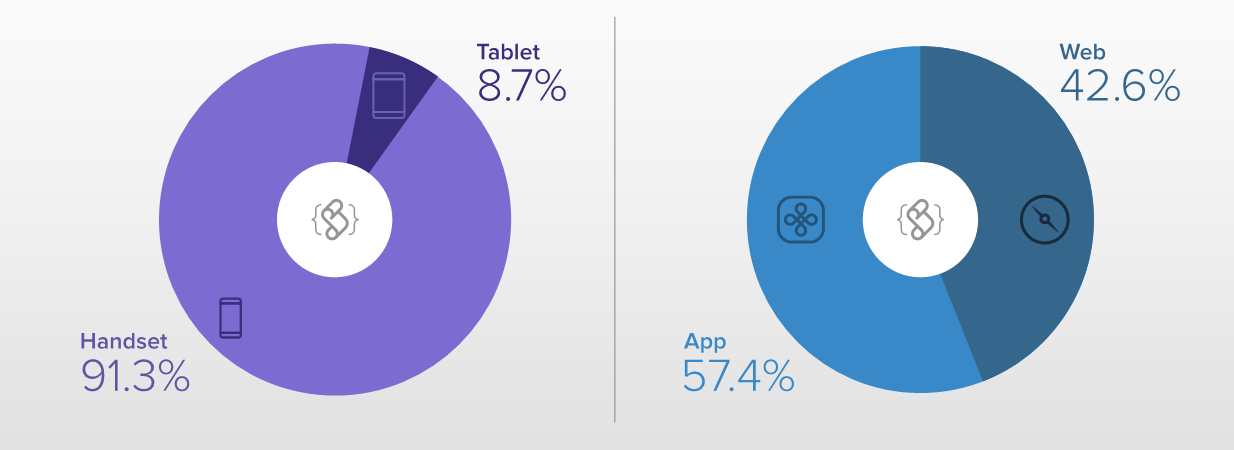
Views by device type (smartphones and tablets) and environment (apps and web)
- Users use smartphones much more than tablets.
- Users use apps more often than the web.
- Accordingly, the number of views is higher in mobile applications.
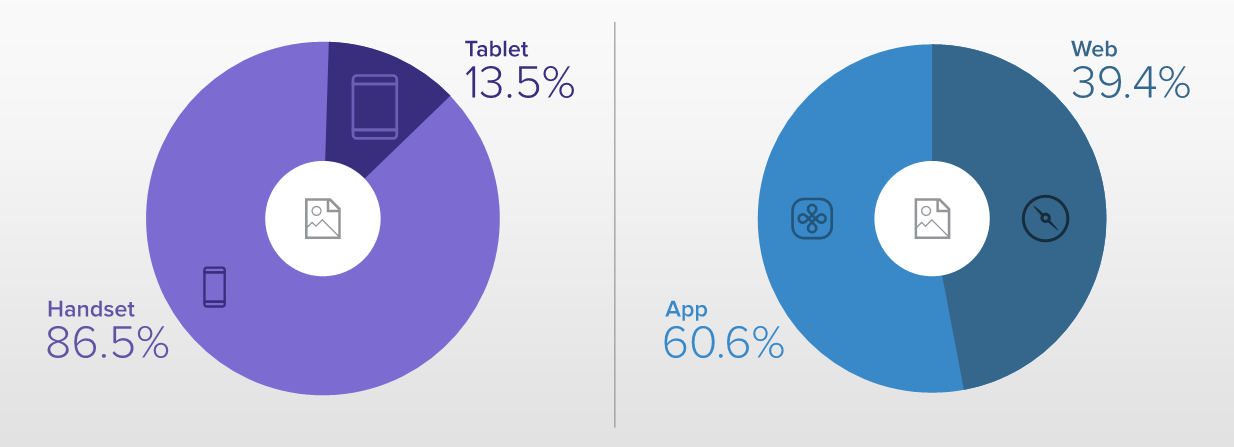
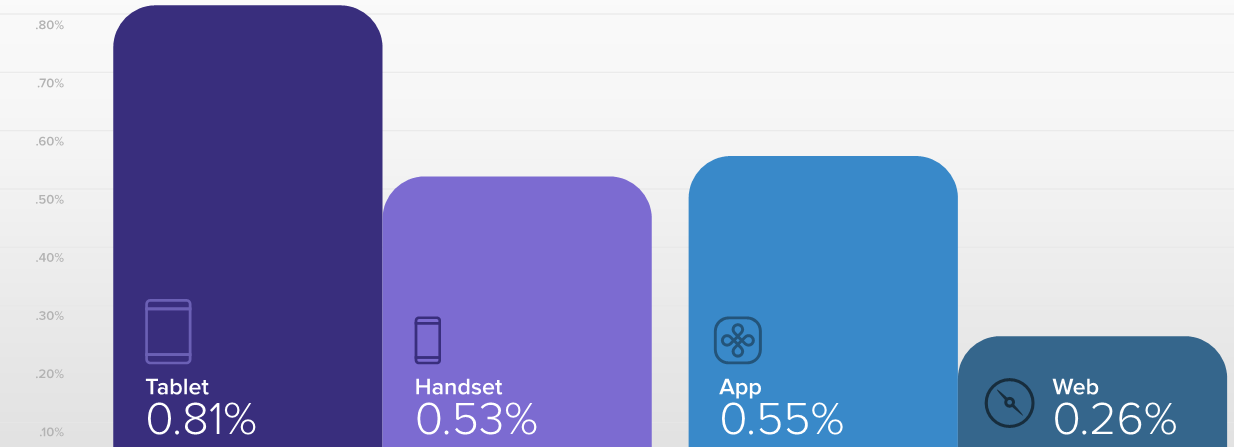
CTR by device type and environment
- Ads on tablets have a 44% higher CTR than on smartphones.
- Advertising in mobile applications is 2 times more effective than similar advertising on the mobile web.
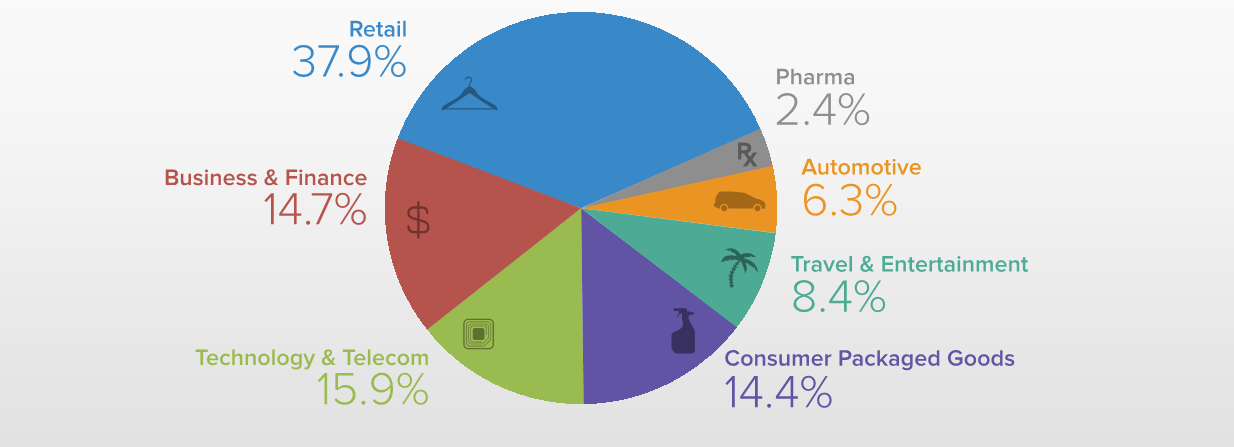
Views by topic
As you can see, the ads that offer retail products are in the lead in terms of views.
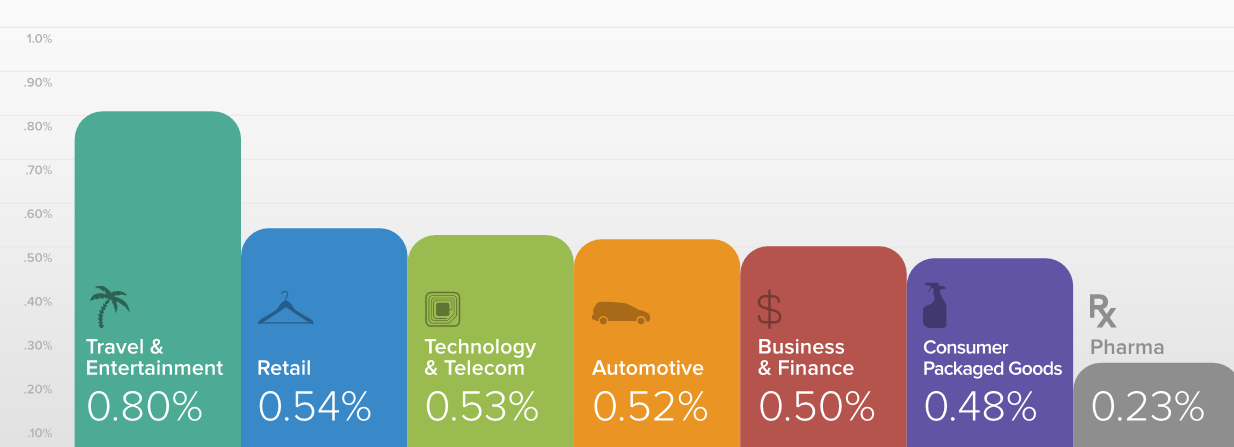
CTR by subject
But banners that can be thematically attributed to tourism and entertainment, but are much more popular with users (on average, they are 60% more popular than others).
Static ad views by device type and environment
- Smartphones have 6 times more static ads than tablets.
- Apps account for 60% of static ad views.
CTR of static ads by device type and environment
CTR on tablets is much higher than on smartphones.
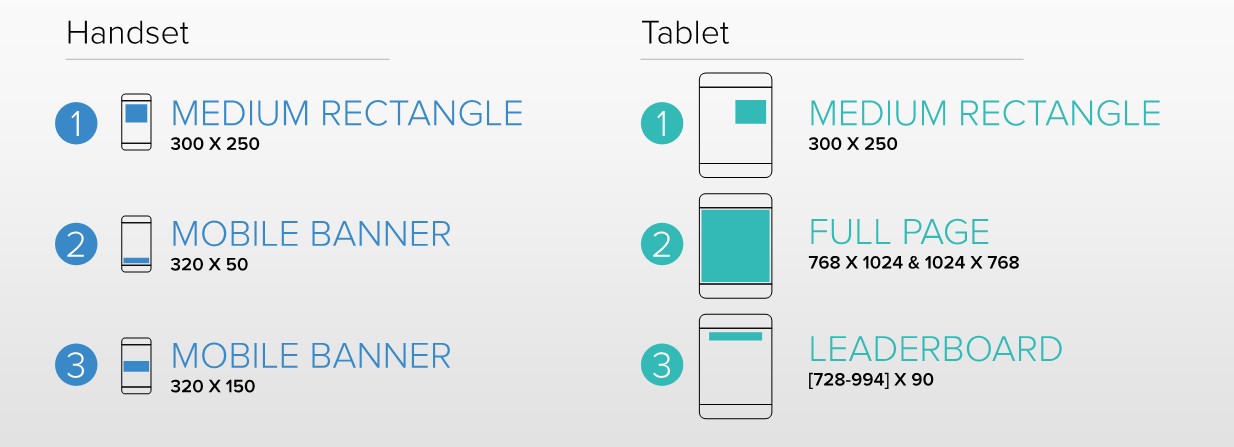
CTR of static ad formats
The difference between the indicators of banners and full-format (interstitial) advertising is much more significant on tablets than on smartphones.
The most effective types of advertising by CTR
For static advertising, the most effective type of banners on tablets and smartphones is a 300 by 250 pixel banner.
The number of views of "rich" ads by device and environment
- Smartphones "serve" 10 times more multimedia advertising (rich media) than tablets.
- There are 30% more multimedia ads in apps than on the mobile web.
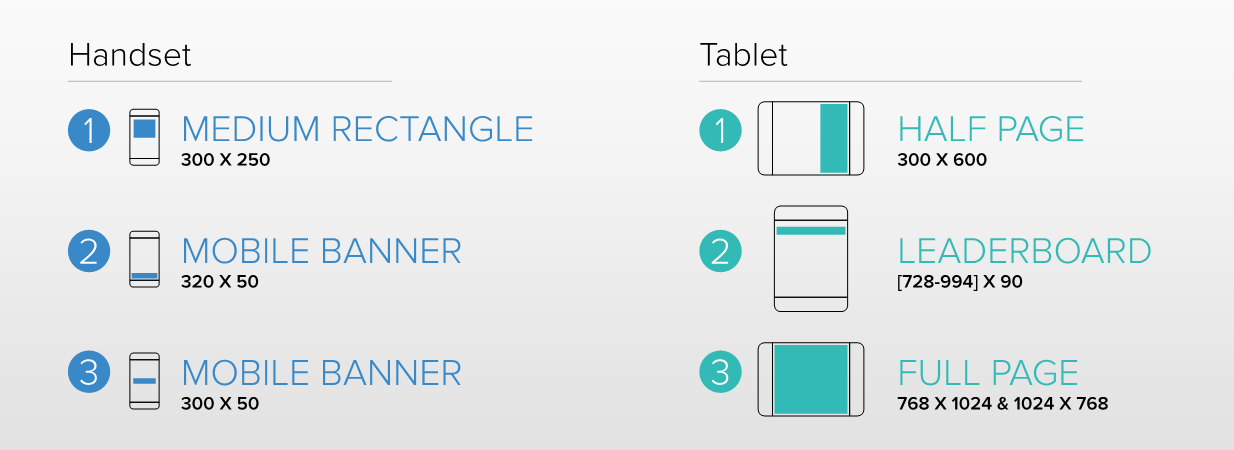
The most high-performance advertising formats by engagement level
Regardless of the type of device, multimedia advertising that takes up half (or so) of the screen is most effective.
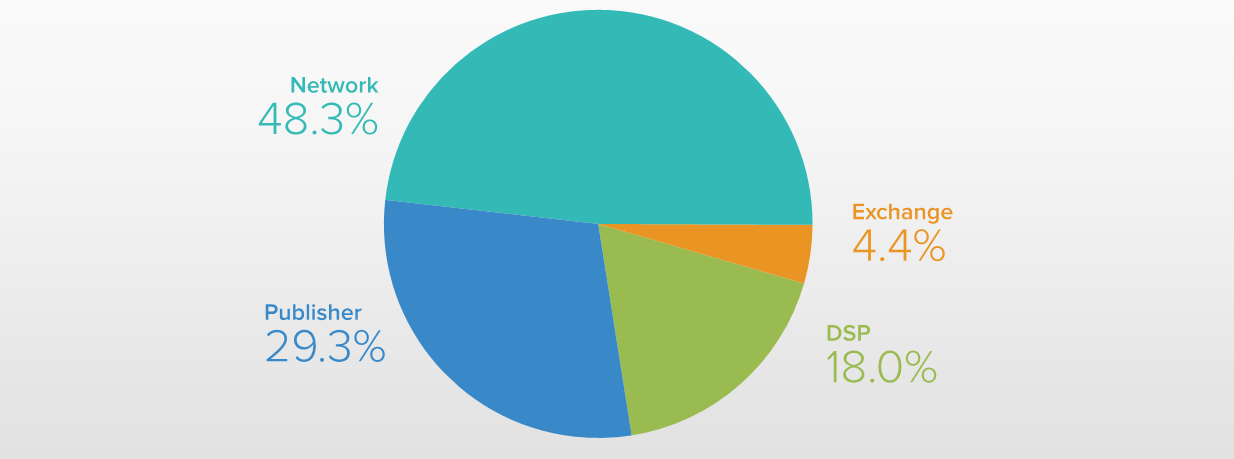
Views by inventory source
Publishers and advertising networks together are responsible for 80% of mobile views.
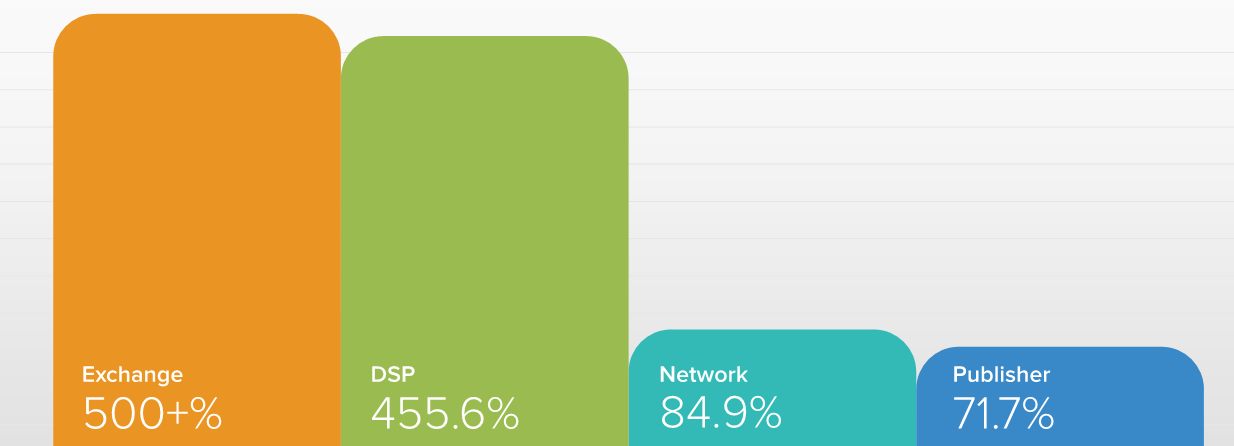
Dynamics of advertising inventory sources by number of views
Despite the fact that publishers and advertising grids are responsible for most of the market, they are far behind cross-traffic (exchange) and DSP (automated purchase systems) in terms of dynamics
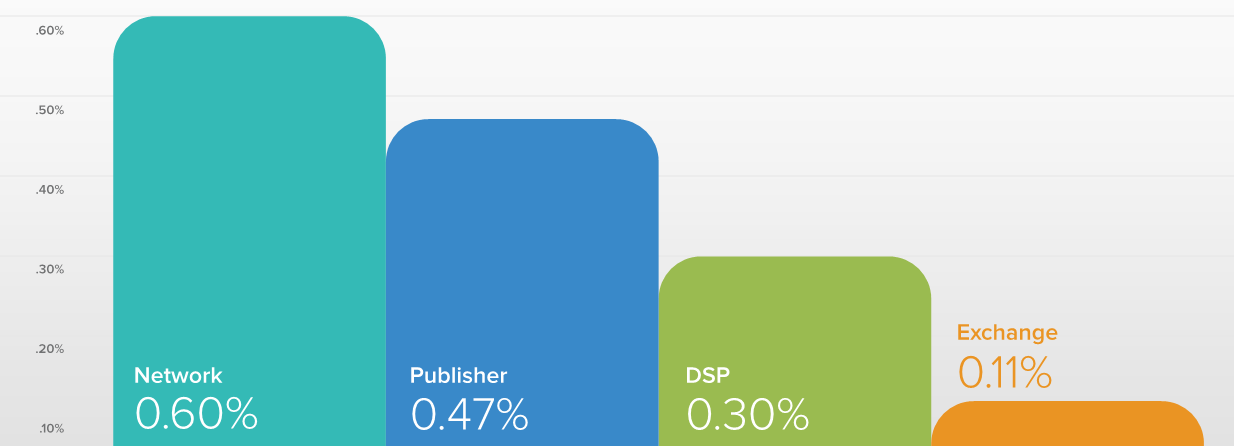
CTR by inventory source
But in terms of performance, advertising networks and publishers are significantly ahead of other inventory sources.
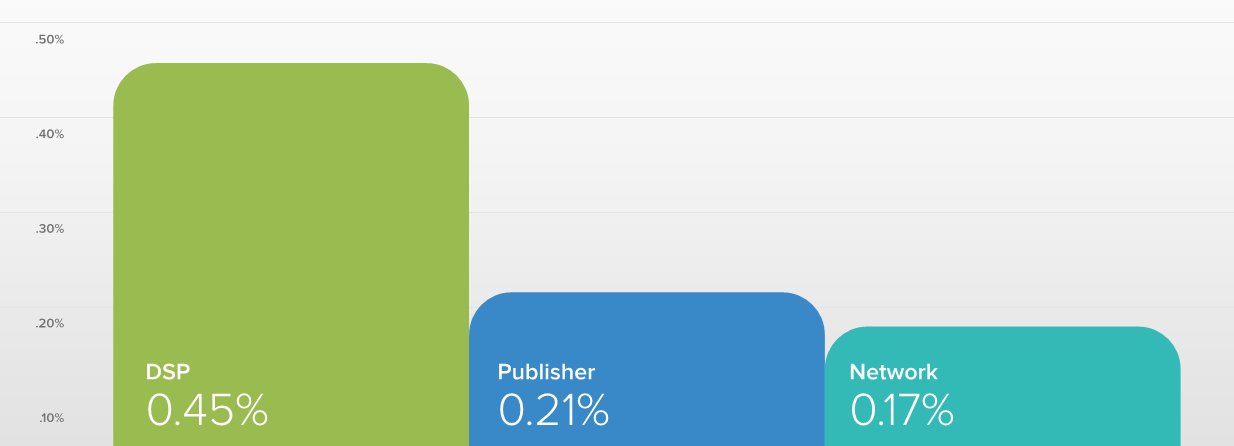
Low-quality traffic by inventory source
Here, in principle, it is possible, and without comment. Those who offer DSP are twice as likely to have bots, "spiders" and other non-human traffic than publishers and advertising networks.
The original version of the study can be downloaded here: http://www.medialets.com/insights/benchmarks-2014-h1/

