Guide to A/B and A/A/B testing of monetization on the Appodeal platform
Appodeal has prepared a detailed tutorial on split testing of monetization on its platform.

The practice of product A/B testing is widespread in mobile marketing. It allows you to quickly understand the reaction of users to:
- new graphics;
- interface changes;
- changes in the location of ad blocks and so on.
The purpose of this material is to tell you how to correctly use split testing to check the effectiveness of those elements that are responsible for the monetization of the application.
The guide is based on the example of working with the Appodeal platform, which, among other things, allows you to check the advertising logic separately, and the waterfall settings separately.
Choosing the subject of testing
The first step is to solve:
- what will be checked (changing which aspect of the application);
- what result is planned to be achieved (what should “grow”).
The success of the test depends on this stage.
Accordingly, during this stage:
- we define the subject of testing;
- we call the desired result that we want to achieve by changing the subject of testing;
- we choose metrics for tracking, which will have to change when the subject of testing changes (according to their new values, it will be clear whether it turned out to come to the desired result).
Which metric is better to choose for tracking
As a rule, we focus on cumulative ARPU at the end of the seventh day (here = LTV of the seventh day).
Cumulative ARPU is calculated by dividing income by the size of the audience. Important: it is calculated only (a) within one group of users who installed the application at one time, (b) the metric increases from day to day.
According to our experience, the focus on cumulative ARPU is the most liquid, since its change indicates a change in all additional metrics.
Sometimes developers also track ARPDAU, however, we believe that this is not the best option. The fact is that the growth of this indicator can negatively affect the retention and engagement of users.
Example: testing was conducted on how an increase in the frequency of ad impressions would affect the application. As a result, ARPDAU grew, but the retention of the first days sank noticeably.
As for why it is worth doing a check exactly at the end of the seventh day, then everything is not so strict. The number of days, based on the results of which the effectiveness of the test should be evaluated, can be adjusted. Here everything depends primarily on the type of application.
We most often conduct A/B testing of the monetization of casual games. For us, the seventh day is the optimal choice. By the end of the first week, we get enough information not only about how the innovation has affected monetization, but also on long-term user retention.
In the case of hyper-casual projects, of course, we will not focus on this time. When operating on them, it makes no sense to maintain a high level of retention over a long distance.
Of course, in addition to the cumulative ARPU, you can rely on other metrics when evaluating performance:
- revenue by N-day;
- ARPDAU;
- retention by N-day;
- the average time spent in the app every day.
In general, the choice of metrics depends entirely on the hypothesis and what results the company wants to achieve.
You can also choose a secondary metric to check.
For example, the task is to test two hypotheses at once:
- according to the first, “the frequency of ad impressions affects the LTV of the seventh day”;
- according to the second, “the frequency of ad impressions affects the retention of the seventh day.”
In this case, it will be very important for us to correctly calculate the cohort of users for such a test. Therefore, we will choose the metric for the calculation, the reliability of which requires the largest number of users.
By the way, just in case, do not forget that part of the metrics (for example, the same cumulative ARPU) is considered only for cohorts of users.
Which hypotheses are worthy of testing?
To check whether your hypothesis is worth starting an A/B test for it is very simple. If you assume that as a result of some changes, the metric being checked will change by no more than 10%, then you should not waste time on testing. You are unlikely to get a reliable and noticeable result on the general traffic.
It is worth testing only those hypotheses that suggest a significant change in the measured metrics.
Hypotheses can be different. Some may affect only monetization indicators (these are waterfall tests), but, as a rule, testing most hypotheses also affects the product metrics of the application.
Here is a list of hypotheses that we have successfully tested, testing their effect on the seventh-day LTV:
- how does the different frequency of full-screen ads affect the economy of the application;
- how does the different frequency of banner updates affect;
- how different configurations of waterfalls and advertising networks affect;
- how do high CPI networks affect user retention and monetization;
- how the inclusion/deactivation of advertising placement affects the indicators.
Can I trust the test results?
The user can determine the probability of correctness of the tests that suits him. We recommend stopping at 95%.
You can even increase the correctness up to 99%, but this will require doubling the number of the group, which means testing time.
Another way to minimize the error is A/A/B testing. Let’s talk about him.
A+A+B = A/A/B
To improve the accuracy of hypothesis testing, Appodeal conducts so-called A/A/B testing.
The essence of testing is to add an additional cohort of users similar to the first one.
This approach makes it possible to neutralize the error when a group shows a random result (if its number is calculated for 95% reliability).
More than three cohorts should not be used in testing, because it will take too much time and users to conduct the test.
The final decision on the choice of testing method depends on the timing of testing and metrics.
How many people should take part in the testing?
There is no universal answer to this question. It all depends on the specific game in a specific period of time.
How to determine if the sample is sufficient?
First. We choose the metric that we will focus on. We take a cumulative ARPU of the seventh day (this is a non-binomial metric).
Second. Unloading the necessary data from mediation. This can be done using the Ad revenue attribution tool. It allows you to get data on revenue for users for the desired period.
The third. We calculate the number of users who should participate in the test using the formula:
n=( (std**2) * (2*(Za+Zb)**2) ) / m**2
where:
- Za=1.96 – for p-value=95 %
- Zb=0.8416 – for a test power equal to 80 %
- m is the sensitivity, the amount of difference that we want to catch
- std is the standard deviation calculated based on historical ad revenue data.
You can also use the statistical significance calculator for non-binomial metrics (there is a free trial version).
Setting up A/A/B test
After the hypotheses are formulated and the metrics for tracking are selected, it’s time to start testing.
Step one — working with the selection
First you need to determine the percentage of users who will participate in the testing.
If you want to run a test, for example, on 60% of users, then you should form three segments of 20% of users in each.
What percentage of users should I stop at all?
We recommend testing on all traffic (it is important to understand that the control group is part of the testing).
Why?
The greater the coverage, the faster the result can be obtained.
Step Two — Creating segments
A segment is a part of the audience that meets certain conditions (for example, selected by gender, age, region, or any other parameter known to the application and sent to the Appodeal SDK).
Segments are used to track statistics for various categories of users and manage ads for these categories.
We start creating a segment by naming it. It will then be listed in the list of segments and will appear in the impression statistics for that particular segment.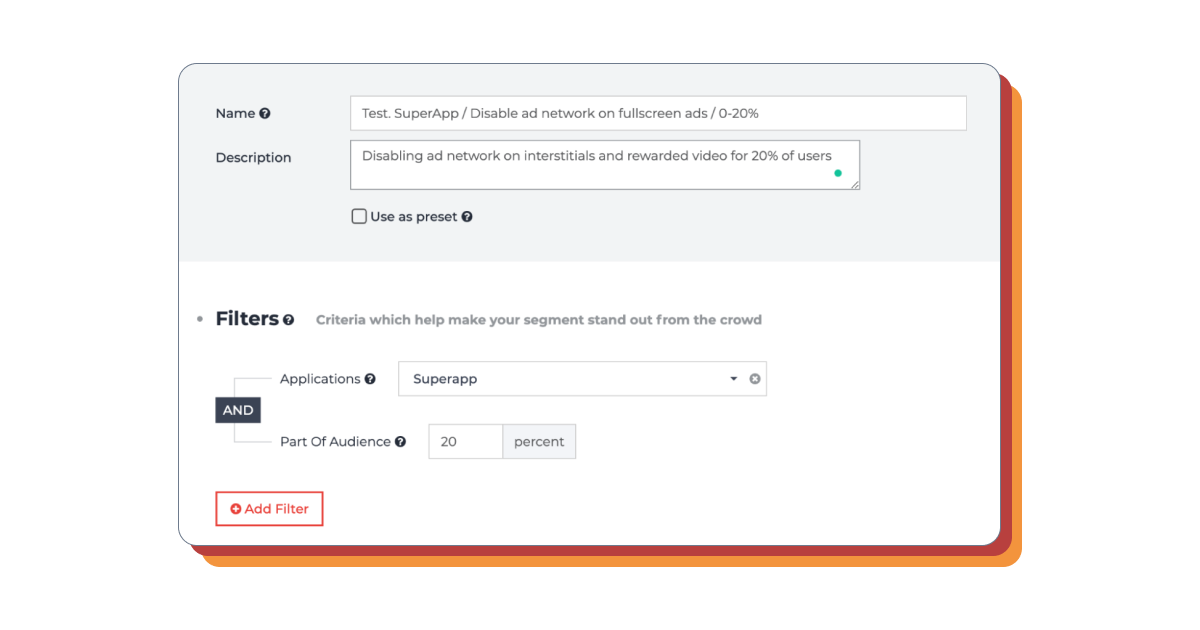
Segment without ads
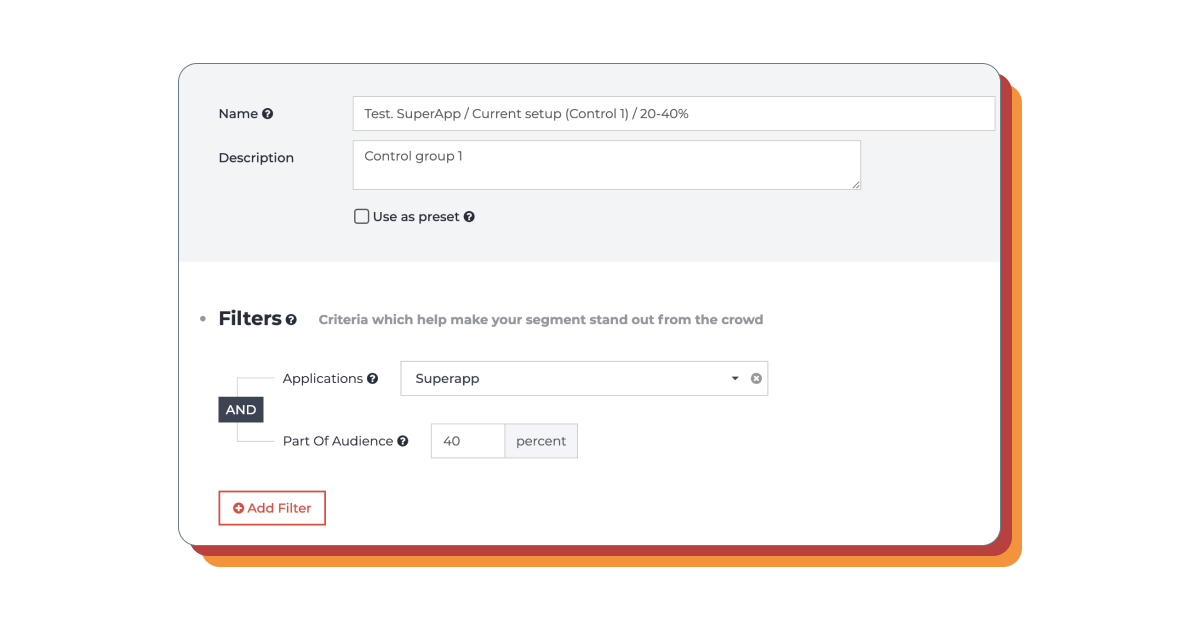
The first control group
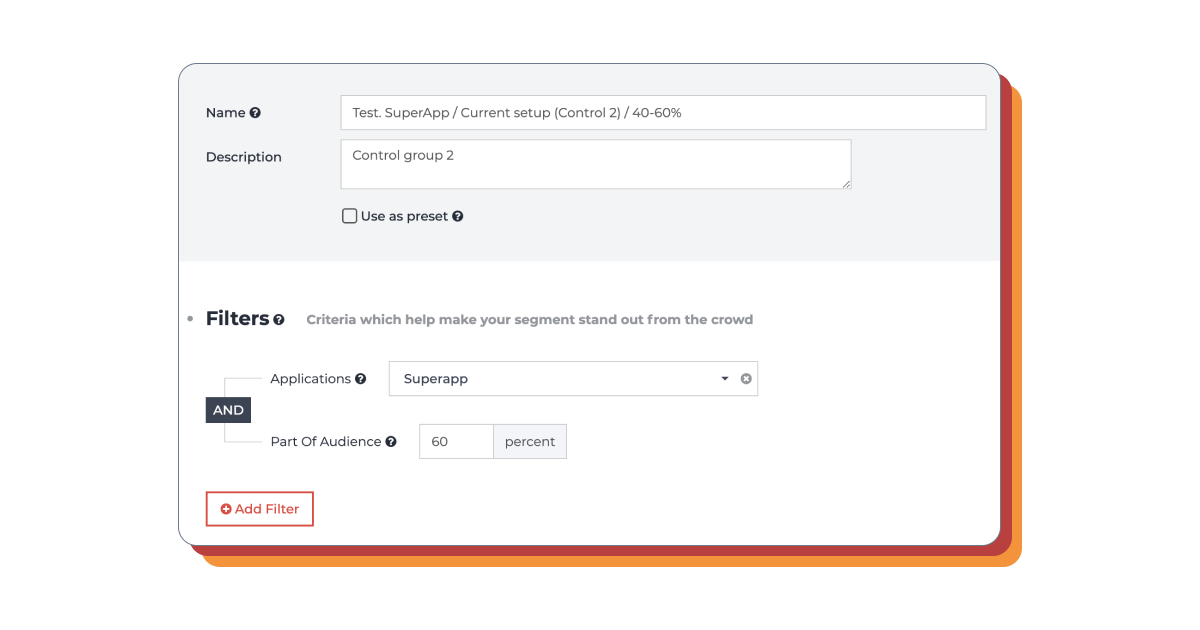
The second control group
Step Three — Setup
After the test segment is created, it needs to be configured depending on which parameter you are going to test.
You can also group users here:
- by device type;
- by application version;
- by average session duration;
- by OS version;
- by making in-app purchases;
- by making purchases in the app n-times;
- by logging into the app;
- by being online and so on.
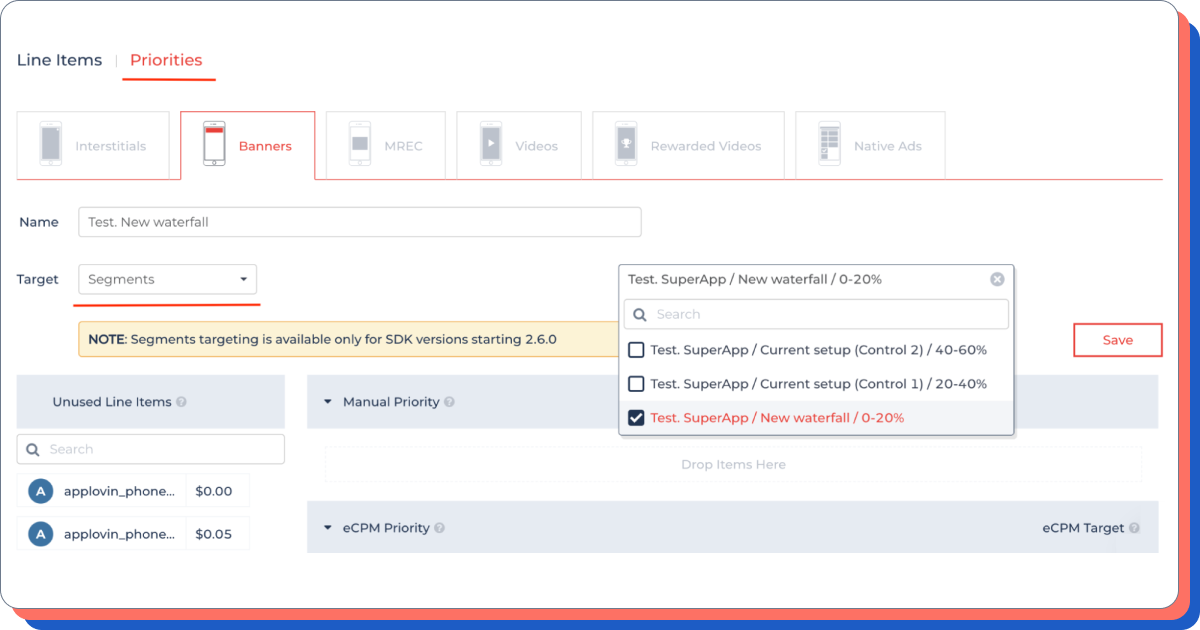
Step Four — Test the new waterfall
What needs to be done:
- switch to DCC;
- select the desired type of advertising;
- create or duplicate a waterfall;
- change ad block settings;
- set up a waterfall on your test segment.
What is most often tested in monetization?
Most often we are talking about checking the advertising network and advertising logic.
Checking the advertising network for a certain type of ad
The inclusion of an additional network in the monetization system can have not only a positive, but also a negative impact on ARPU and retention level. Therefore, it needs to be tested.
To perform the test, you must add the appropriate parameter to the test segment.
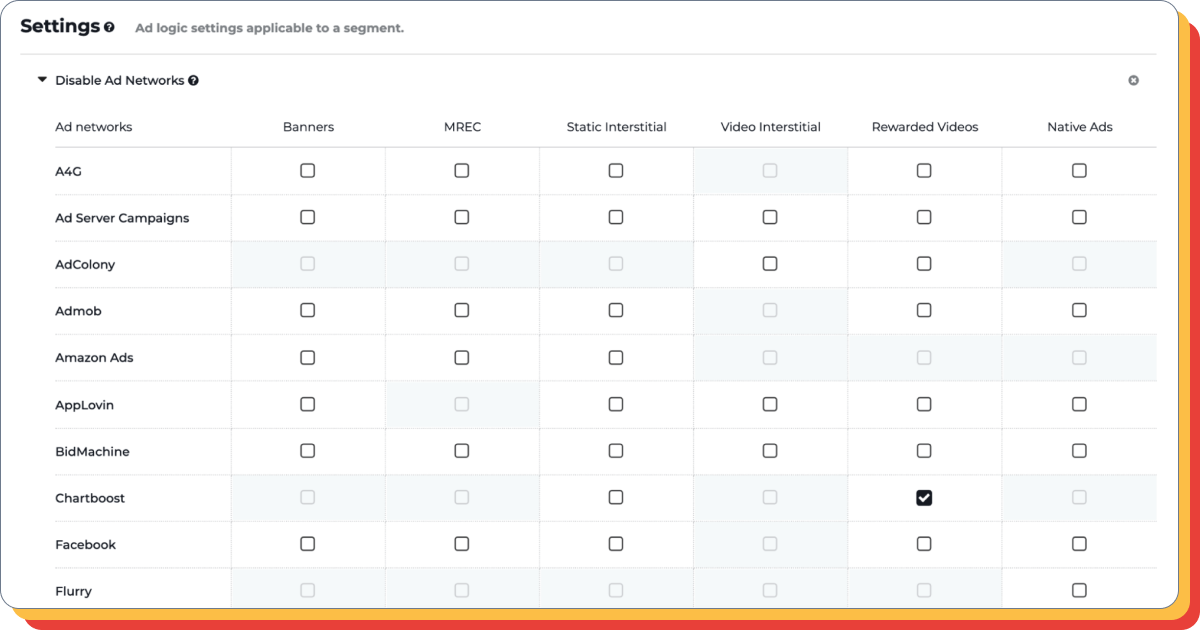
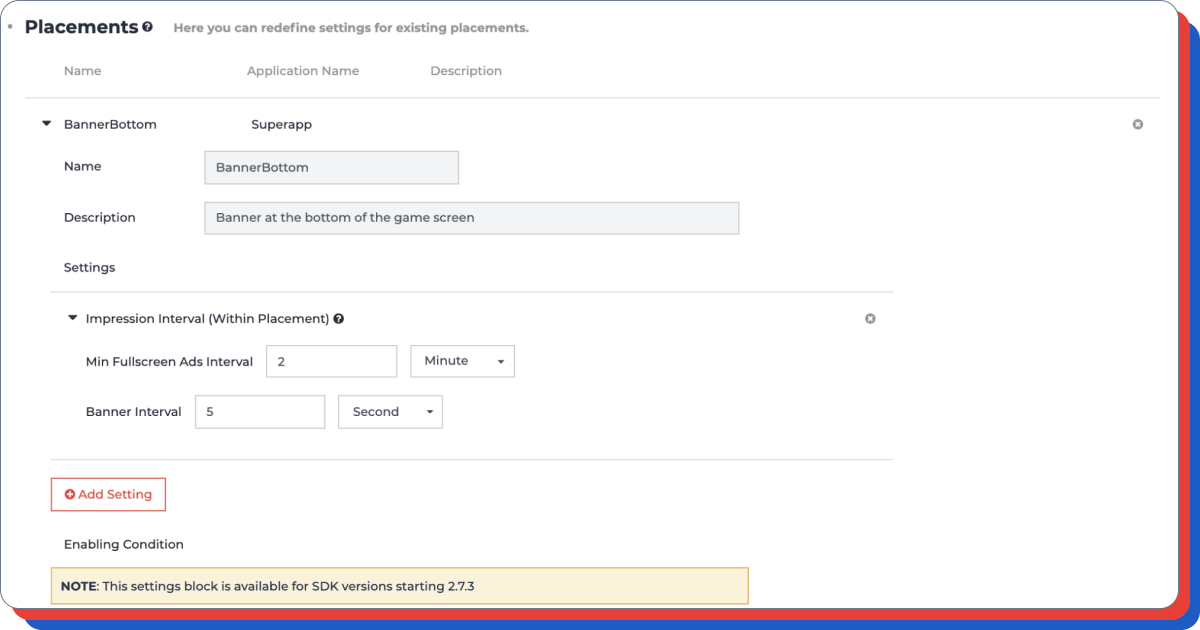
Checking the advertising logic
Before testing, you need to add a placement corresponding to what type of advertising you are going to test, and do not forget to make the necessary settings for all GEO (set the frequency of updates, the start time of advertising, intervals, and so on).

What do such checks lead to?
In the success story of Join Blocks, a game that passed the Appodeal business accelerator, it was such experiments that helped to find the most optimal interval between ad impressions.
The main markets of Join Blocks were very different from each other, as well as the behavior of players from these countries. Therefore, the interval between ad impressions had to be determined separately for the CIS, USA and Brazil markets. This optimization led to an increase in ARPU by 20% in the USA and by 40% in the CIS markets.
Important: before proceeding to the analysis of the test, you need to wait until the statistics of the day you need for users are finalized. Since the last users will get into the test later, and you, for example, look at the metrics of the seventh day, statistics on them should accumulate for some time so that the result is correct.
How to analyze the results of A/A/B testing
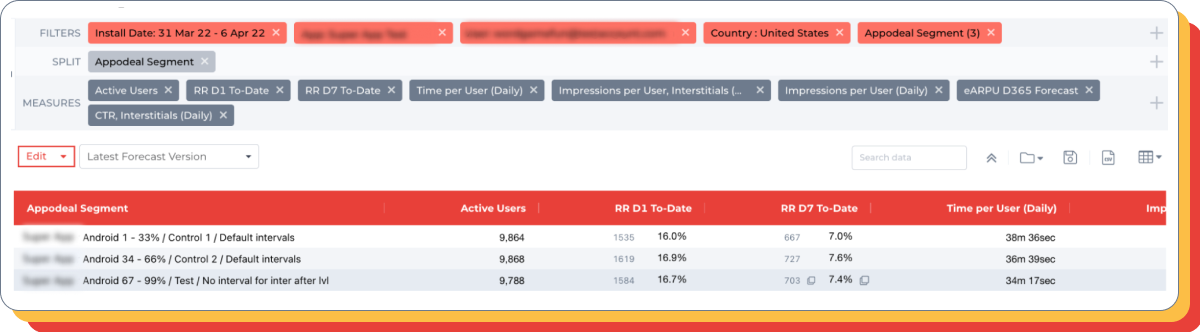
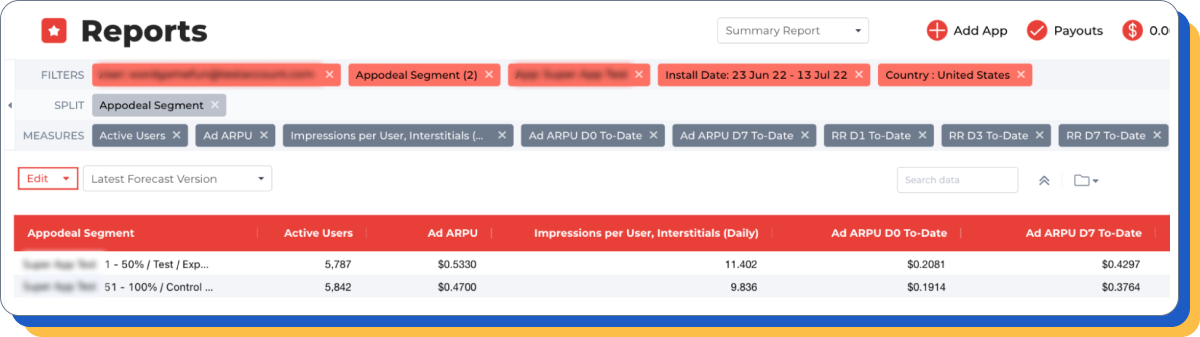
1) Go to the Appodeal control panel and create a report with the indicators in question. Don’t forget to select the installation date in the filters to build cohort reports.
2) You can start the analysis already at the end of the first week of testing, but only if the required number of users has been collected in each of the segments. It is not recommended to conduct the test for too long. In this case, it may be influenced by external factors.
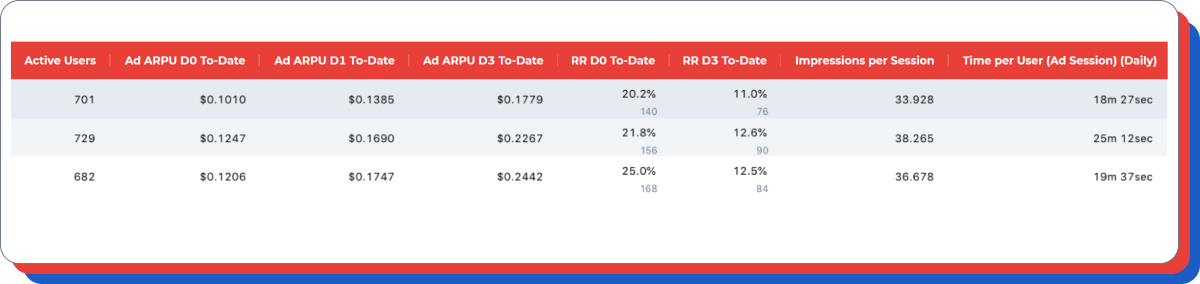
3) Analyze how your test affected the cumulative Ad ARPU of the seventh day.
Additional comment: In the example above, we see that the Ad ARPU of the test cohort is 20% less than the Ad ARPU of the control cohorts.
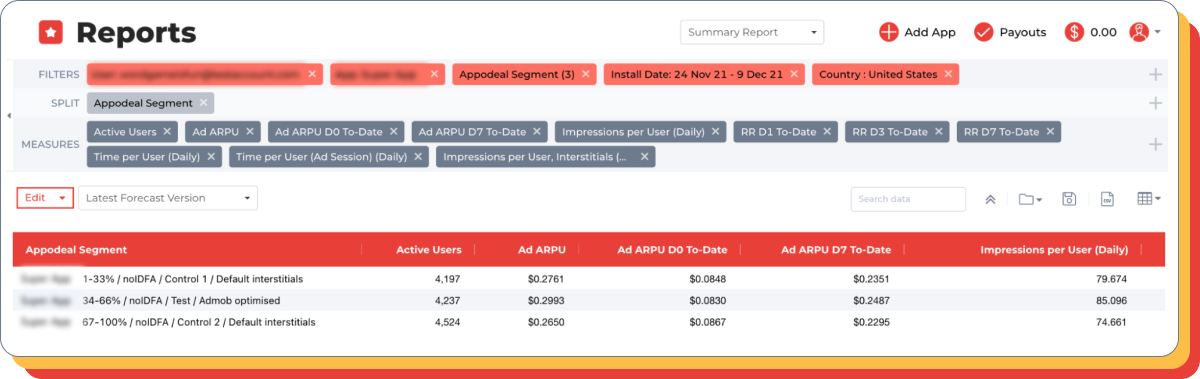
4) Pay attention to the retention rate and the time spent by the user in the game per day. If the hypothesis suggests that the test should affect retention, then it is better to wait longer to collect more data.
Additional comment: it is worth paying attention only if (a) the hypothesis suggests an impact on these indicators, (b) the Ad ARPU of the first days in the test and control groups is close/ the same, and the late Ad ARPU in one of the groups is higher.
By the way, in this particular case, there are not enough active users to make a decision about the retention level (metrics differ greatly from each other in each control group).
5) The conclusion about the situation is accepted.
In this case, the conclusion is as follows: since the Ad ARPU differences between the test and control groups are high, and the control groups differ less in metrics than the test groups, we can conclude that the test group is the loser. The experiment can be completed.
Remember that a successful test should show significant changes to the targets in the test group — ideally 10% or more. Tests with a smaller change can be considered unsuccessful. If the results are not obvious, you can continue the test for another week to collect more data.
Conclusions can be started if:
- the test group differs from both control groups by more than 10% (if a lower result is demonstrated, it is better to recalculate the statistical significance);
- the control groups differ from each other less than any of them from the test group;
- you have the required number of users.
Specific examples of A/A/B testing of monetization
Full-screen banner interval test after the end of the round
Hypothesis: an increase in the frequency of banner displays will lead to revenue growth, but will not significantly affect other important indicators.
Control group: the default interval between ad impressions is two minutes.
Test group: there is no default interval (ads are shown more often).

Result: in the test cohort, the main metric (Ad ARPU D7) is 10-15% higher than in the control groups. At the same time, there are no significant differences between the groups on the side metrics.
Waterfall Configuration Test
Hypothesis: adding additional ad blocks when removing a cheap ad block on interstitial will lead to an improvement in ARPU 7 days.
Control group: current (default) setup.
Test group: The following additional ad blocks have been added:
- + Admob 25, 35, 45, 60;
- + Notsy 40, 50;
- – Admob 0 (all price).
Please note: Appodeal restricts the survey of ad blocks in Admob (it is allowed to do no more than three surveys per impression).
There is no such limit in other mediation services. However, there is a risk that Admob itself will pessimize if more than three calls are used in the waterfall.
Results: the addition of additional ad blocks gave a positive result (+15%) for ARPU 7 days. The occupancy rate and the number of ad impressions per user has also increased (and this is when removing a cheap ad block).
Waterfall optimization for zero-IDFA users (those who do not consent to the use of The Identifier for Advertisers)
Hypothesis: the focus on low-flor advertising will lead to an increase in revenue among the audience that is not ready to share personal data.
Control group: default setup.
Test group: removed a lot of units with high flora, which are poorly filled. Instead, more units with low flora, whose occupancy rate is higher, have been added.
Since less expensive advertising is usually available for users who do not provide their own data through an advertising identifier, optimizing the waterfall to lower price thresholds gave a good result in the application.
The occupancy rate increased, the number of impressions per user increased, which eventually led to an increase in ARPU by about 8-10%.