AppsFlyer: Paying players in Asia spend $20.83 on IAP monthly
The marketing and analytical company AppsFlyer conducted a large-scale study to find out what trends exist in the field of microtransactions in the global mobile market. We share a brief version.
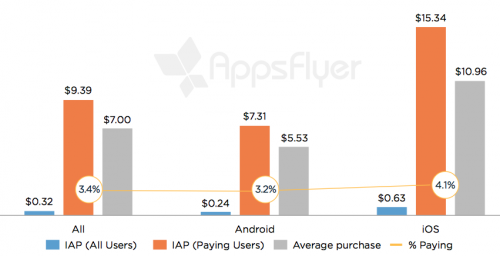
The average global indicators are as follows: 3.5% of users make purchases in gaming applications. The paying user leaves an average of $9.39 per month in the game. At the same time, the average revenue from the IAP in terms of all players is $0.32 per month.
The statistics on the platforms are as follows: owners of “apple” devices spend much more in games than Android users. The average microtransaction of an iOS user is $10.96. For Android, the figure is $5.53. The average revenue from a paying user on iOS is also higher: $15.34 versus $7.31.
If we take individual regions, the statistics vary.
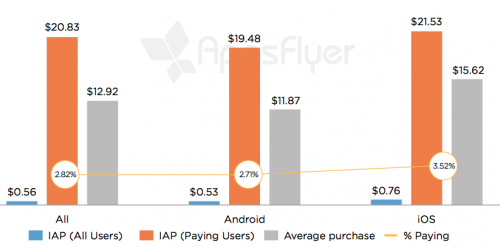
Residents of the Asian region spend much more on games compared to users from other countries. Paying players make up 2.82% of the total number of gamers. The average purchase price is $12.92. The average income from a paying user is $20.83. And the income from IAP in terms of paying and non-paying users is $0.56.
The difference in platforms in Asia remains, albeit not so serious. The number of paying users on iOS is 3.52%, on Android – 2.71%. The average purchase on iOS is $15.62, on Android – $11.87. The average income from a paying user on iOS is $21.53, on Android – $19.48. And the average income from IAP in terms of paying and non-paying users is $0.76 (iOS) and $0.53 (Android).
We should add that AppsFlyer experts do not specify which Asian countries they are talking about. According to the figures, it can be assumed that these are South Korea and Japan, since in China the number of paying users is very low, as is the average income from a paying user, and Android is the leading platform.
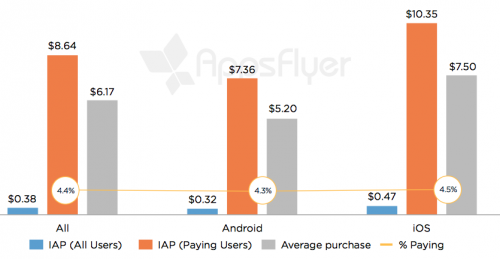
The same figures for North America look completely different. There are 4.4% of paying players in the country. The average purchase price is $5.77. The average income from a paying user is $4.34. In terms of paying and non-paying users, the income from the IAP is $0.19.
The difference in platforms in North America is the reverse of that observed in the rest of the world. On Android, 4.3% of paying users, the average purchase is $10.56, the average income from a paying user is $3.96. Income from IAP in terms of all users is $0.25. 4.5% of players pay on iOS. The cost of the average purchase is $5.67, the average income from the paying player is $4.71, and the income from the IAP in terms of paying and non-paying is $0.16.
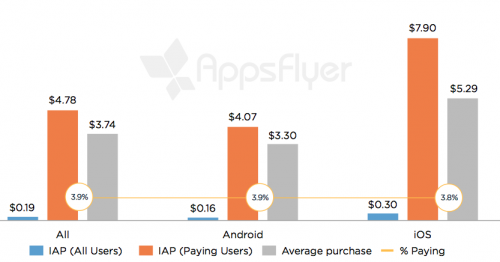
In Europe, the numbers are lower. The average purchase costs $3.74. The average income from a paying user is $4.34 and the same $0.19 in terms of paying and non-paying players.
Paying players in Europe are 3.9% of the total. iOS leads in Europe, as well as in Asia, with an average “check” of $5.29, an average income from a paying user of $7.90 and an average income from IAP in terms of paying and non-paying users – $0.30. Paying players on the “apple” 3.8%. On Android, there are slightly more of them – 3.9%. However, they bring less money. The cost of an average purchase is $3.30, the average income from a paying user is $4.07. The average income from IAP in terms of paying and non-paying on Android is $0.16.
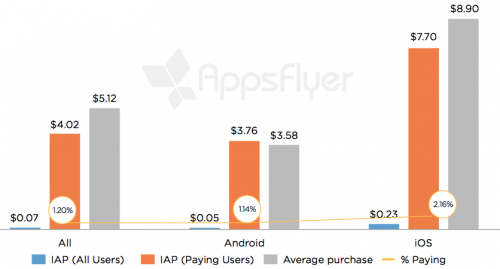
The lowest numbers are in Latin America. The local market is still developing. There are few paying users there – on average only 1.2%. The average “check” here is $5.12, the average income from a paying user is $4.02, and the average income from IAP in terms of all users is $0.07.
The difference in platforms in this market is dramatic. Paying users on iOS – 2.16%, while on Android – 1.14%. The average purchase is $8,9 and $3,58, respectively. The average income from a paying user is $7.7 on iOS and $3.76 on Android. And the income from microtransactions in terms of paying and non-paying players on iOS is almost 4 times more than on Android: $0.23 versus $ 0.05.
According to AppsFlyer experts, it is in the Latin American market that the difference in income between paying and non-paying users is especially large.
The study lasted from April to May 2016. Transactions in the amount of 300 million in 1 thousand gaming and non-gaming applications were studied. The number of unique users was 100 million, and the number of purchases they made was almost 30 million.
Source: AppsFlyer
