Swrve: 0.13% of players are responsible for 60% of revenue from mobile games
The analytical company Swrve shared a sad report, according to which: there are few paying players, and among them those who pay well – even less.

In winter, Swrve published a report according to which last January only 1.5% of monthly active users made a payment. In July, when the analytical company repeated its research, the indicators turned out to be even worse. Only 1.35% of active users made payments during the second month of summer.
If we take this 1.35% for 100%, then almost exactly half of them make one purchase per month. Those who make five or more payments per month – only 16.2%.
Percentage of players making the total number of purchases (per month)The average monthly expense in July was $24.93 (in January it was $22).

This amount, according to Swrve, coincides with the “typical” MRPPU (monthly income from each paying user).
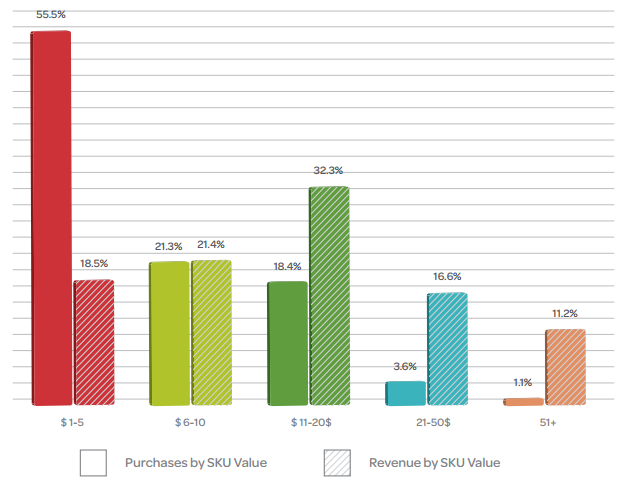
The average number of purchases per month is slightly below three, the average check is about $8.34. But these are still “vacuum” numbers. Much more interesting is the graph below, which reflects not only the most popular, but also the most profitable types of transfers.
A graph of the value of purchase types by the number of transactions (Purchases by SKU Value) and their value (Revenue by SKU Value) As you can see, transfers from $1 to $5 are the most popular.

But their share in income is not very large – 18.5%. Payments from $11 to $20 are less popular, but they make the most tangible contribution to the “basket”. 11% of all income comes from payments above $50.
Out of curiosity: 62% of revenue comes from the top 10% of payers or from 0.13% of all users. Well, let’s add that 60% of payers are responsible for only 11% of revenue.
As for the time of the first payment. 50% of them occur in the first day after the launch of the game (the average time before the first purchase is 20 hours).
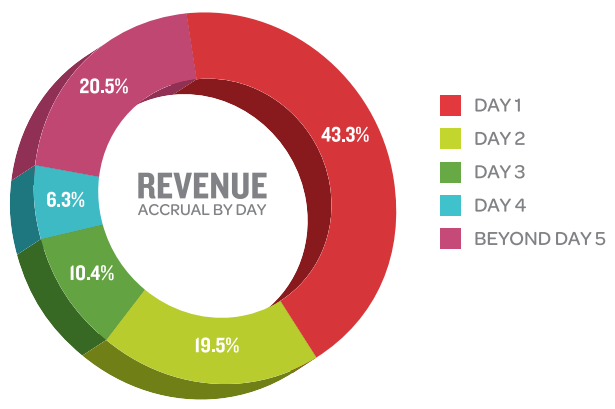
Time scale of the first purchaseMoreover, most of the money spent on the game during one month also falls on the first day – 43.3%.

Distribution of cumulative income by dayWe do not want to draw any far-reaching conclusions, but it is clear that whales are still the determining financial force.

A source: http://www.swrve.com