Android Market Statistics
 We offer statistics on Android Market categories: which ones have the most apps, which days have the most releases, and which apps “earn” the most money.
The most “competitive” categories in the Android Market are Tools, Entertainment, Personalization. It is in them, according to statistics, that the most applications appear, which means that it is more difficult for “beginners” to be noticed.
Here you can view the data for the previous month.
The subcategories Brain & Puzzle, Arcade & Action, Casual are leading in the Games category.
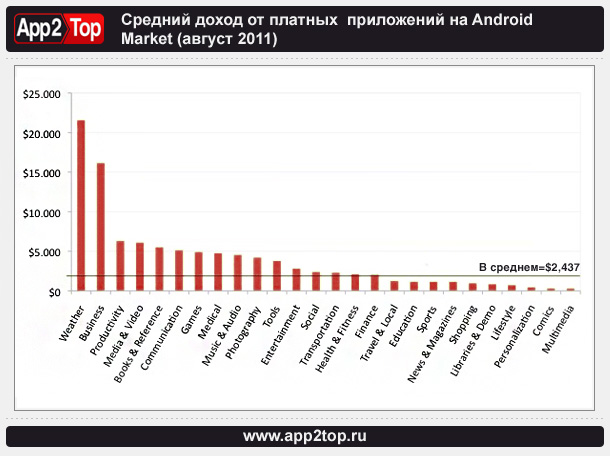
However, according to the results of Research2Guidance, applications from the Weather category bring the most money (“Weather”). This can be explained by the fact that, firstly, the “Weather” category in the Android Market is small, so there is less competition between programs. Secondly, weather informers are installed by almost every owner of a mobile device.
The second and third places in terms of revenue were taken by applications from the categories “Business” and “Work”. Programs from the categories “Comics”, “Personalization” and “Lifestyle” bring the least profit to their developers.
The most popular day in the Android Market (as well as in the Apple App Store, by the way) is Thursday. It is on this day of the week that the most app releases occur. Apparently, publishers are counting on the weekend, although, as we wrote, smartphone users always have prime time).
We have already published similar data on the Apple App Store – you can view them here and here.


