Infographics: dynamics of monthly incomes of three Candy Crush, two Clash and a couple of Pokémon projects
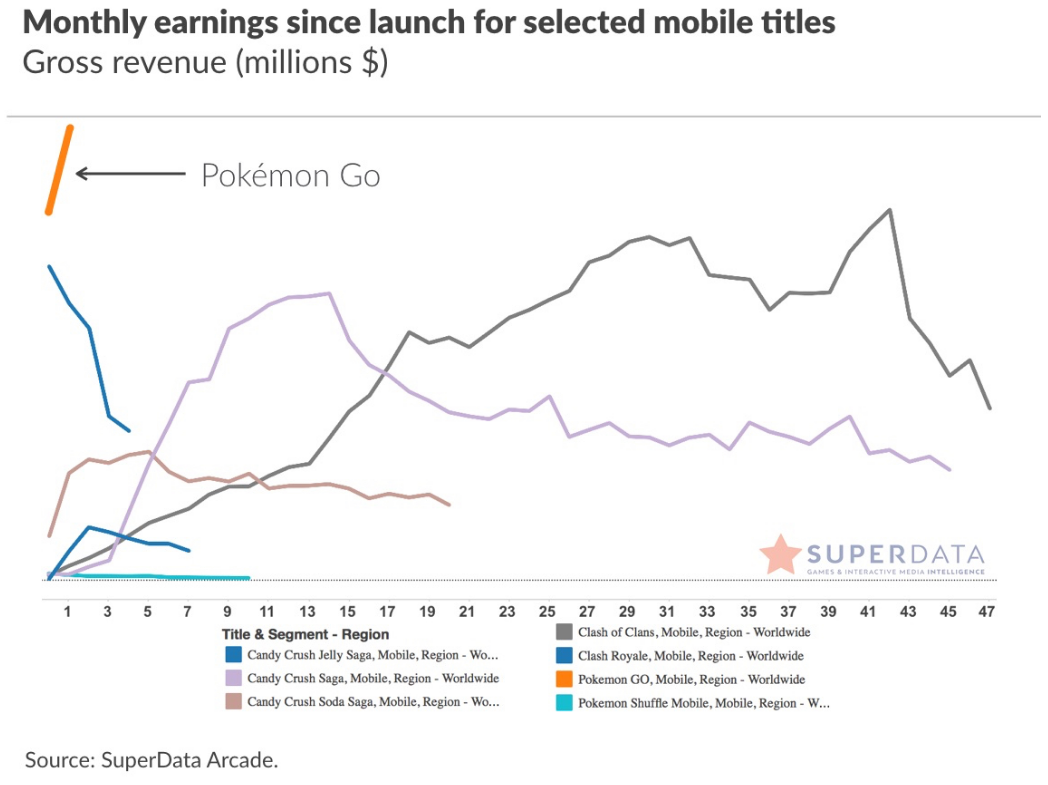
Superdata compared the dynamics of monthly earnings of seven popular mobile games with each other.

The company compared the dynamics of sales since the release of each game. The common starting point for each game on the chart just below is its worldwide launch. For example, for Clash of Clans it is August 2012, and for Clash Royale it is March 2016.

Three selected games out of seven on the chart belong to the Candy Crush brand: Saga, Soda Saga and Jelly Saga. Of these, the original project, Saga, has the highest indicators. The earnings of the last part – Jelly Saga – are the smallest. At the peak of sales, it did not achieve comparable results even with Soda Saga.
Two more titles on the chart belong to the franchise – Clash: Clash of Clans and Clash Royale. The latter demonstrates a very strong drop in sales by the fifth month of being on the market. It is noteworthy that the decline in Clash of Clans revenue begins simultaneously with the release of Clash Royale. Before the release of the new product, the monthly income of the strategy was at its maximum.
The last two titles belong to the Pokémon brand: three-in-a-row Pokémon Shuffle Mobile and Pokémon GO. The income of the latter is the largest among all the titles presented.
Source: Superdata