Research: TV advertising is more attractive than mobile
Users spend more time on mobile devices than watching TV. But they still treat mobile video advertising worse than TV commercials. The analytical company MillwardBrown came to such conclusions.
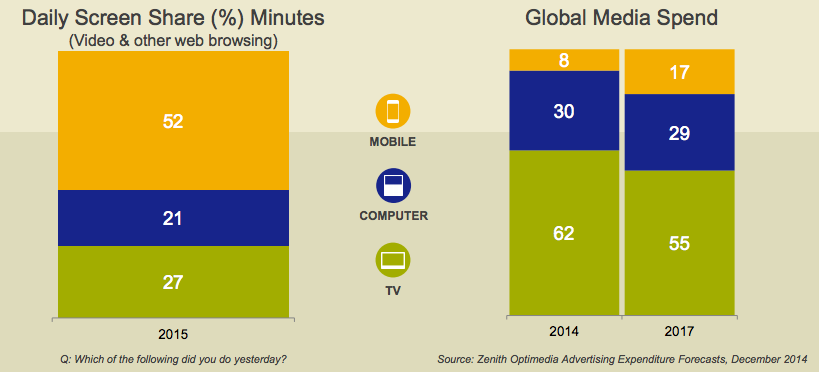
If we take the total amount of time that the user spends in front of the screen for 100%, then 52% of this time will belong to the mobile device. TV will account for 27%.
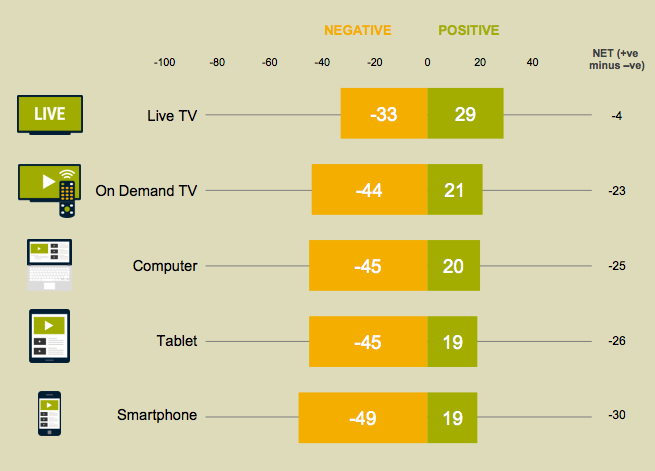
Nevertheless, users are less averse to TV advertising than to advertising on mobile.
33% of users negatively evaluate video advertising on TV. For smartphones, this number is 49%, and for tablets – 45%. 29% of TV commercials seem interesting. In the case of smartphones, only 19% of viewers consider video advertising interesting. The same is true with tablets.
MillwardBrown experts give tips on how to make video advertising on mobile effective. Users love when they are given the freedom of choice. Less negativity is caused by videos that can be closed. Funny or useful videos are less often closed, as well as those where the logo of a well-known brand appears in the first five seconds.
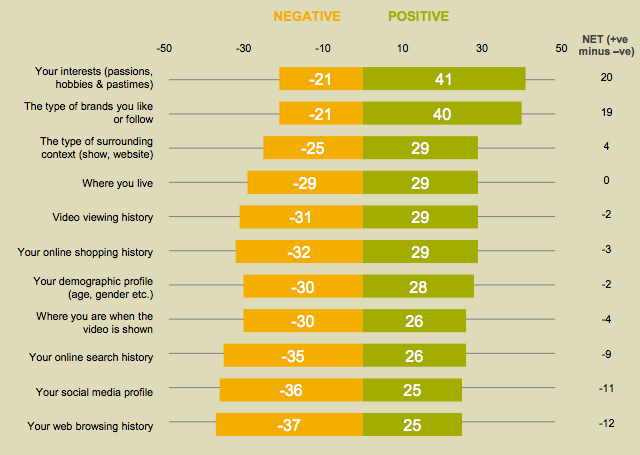
Users respond best to videos that relate to hobbies, interests, and so on. For example, cat breeders will respond positively to the advertising of scratching posts. At the same time, paradoxically, advertising based on the search history in the browser causes users the most negativity.
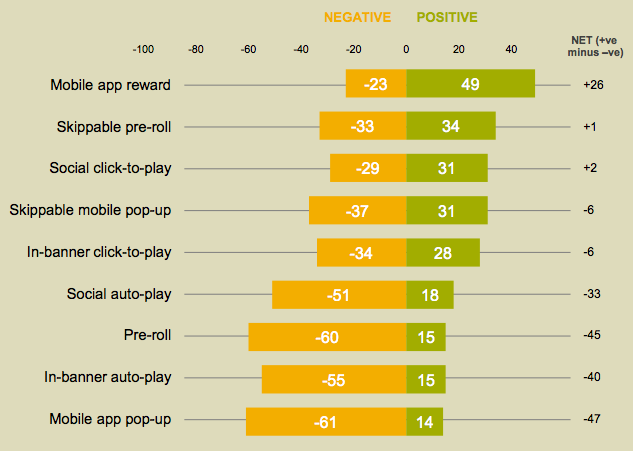
The most popular mobile format is motivated advertising. Only 23% of users are negative about it, and 49% are positive about it. They react the worst to pop-up ads: 61% of users have a negative attitude to this format. (Note in parentheses that it seems strange to us to compare the type of advertising with the format).
The first five seconds are crucial. During this time, the user determines whether to watch the ad further or not. If he managed to get interested, he will watch the video to the end (however, if it lasts no more than 30 seconds).
We add that for the study, the company studied data on 13.5 thousand users from different countries. The age of the respondents is from 16 to 45.
A source: http://www.millwardbrown.com


