Liftoff: CPI for casual games on Android increased by 120% on the background of the new IDFA policy
The Liftoff marketing platform has prepared a large report on the state of the advertising market in the casual games segment. The company reviewed how CPI and ROAS indicators have changed over the year for different subgenres, platforms and regions, and also talked about the most popular advertising formats.The Liftoff study is based on data from March 1, 2020 to February 28, 2021.
The company analyzed 340 billion ad impressions for 416 mobile games.
It is worth noting that Liftoff divides all casual projects into three categories:
- lifestyle — this includes interactive stories, games about interior decoration, as well as rhythmic and musical titles;puzzles — match-3, solitaire games, hidden object search, word games, coloring books and quizzes;
- simulators — this includes games about the construction of cities, various taikuns and titles about breeding and caring for pets.
- General CPI and ROAS indicators for casual games
The average CPI (price per installation) in 2020 was $1.96 — an increase of 45.2%.
- Thus, companies pay much more to attract users. Among the main reasons are increased competition in the genre, the scattered attention of users of casual titles and the increase in spending on tests and advertising campaigns before entering the post—IDFA era.In April last year, when massive lockdowns began in the countries, the CPI turned out to be the lowest — $ 1.21. However, by February 2021, it had more than doubled and was equal to $3.19.
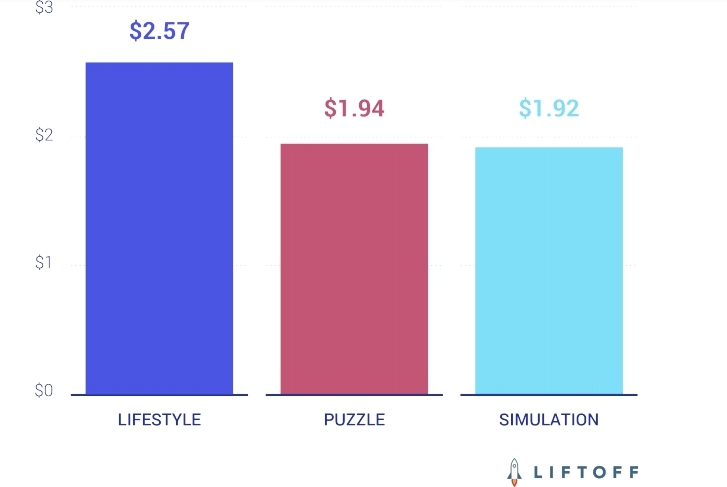
- The most expensive installation is for lifestyle games — the average CPI is $ 2.57.
- But the indicators of puzzles and simulators are almost identical — $ 1.94 and $ 1.92, respectively. At the same time, Liftoff notes that match-3 developers have to add more narrative elements to games in order to retain users.CPI for casual games of different genres
Based on the dynamics of ROAS (profitability of advertising expenses), it can also be concluded that attracting users has become more expensive.
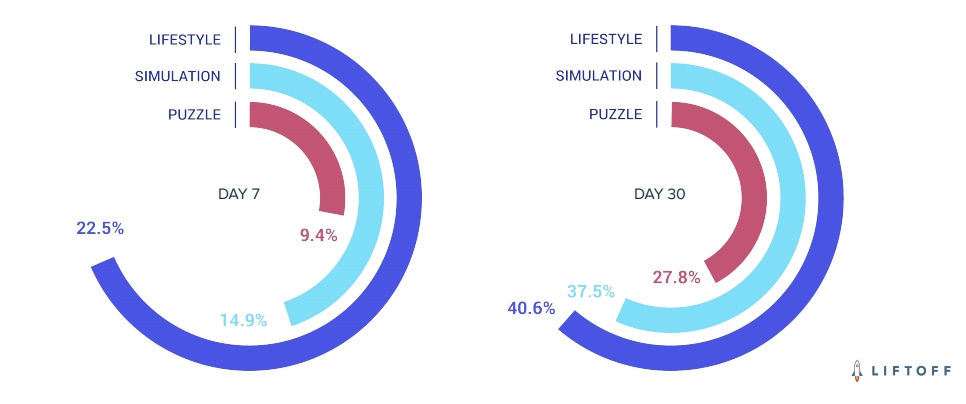
- In annual terms, this indicator for casual games fell to 10.6% for the seventh day (a decrease of 1.8 percentage points) — this is lower than the average result among all applications in 2020, which was 18.8%. The ROAS of the 30th day fell to 29.6% (a decrease of 7.5 percentage points).Advertising works most effectively for lifestyle games.
- The D7 ROAS score for this genre is 22.5%, which is 13.1 percentage points higher than puzzles. For D7 simulators, ROAS is equal to 14.9%.ROAS for casual games of different genres
Advertising formats
The greatest growth was shown by playables (advertising that can be played).
- On average, the number of impressions of this type of advertising grew by 53% every month (compared to July last year). The largest increase occurred in January 2021 — 113%.Commercials that reward users for viewing also showed good growth.
- In January, the number of impressions doubled altogether — by 113% compared to July last year.But banner advertising throughout the year showed not very high indicators.
- However, in January there was an unexpected boom, when the number of her impressions increased by 128% compared to July 2020.Change in the number of impressions of different types of ads (compared to July 2020)
Comparison of CPI and ROAS for Android and iOS
If we talk about genres, the CPI in lifestyle games almost does not differ depending on the platform.
- The cost of installation on Android is $2, and on iOS — $2.96. At the same time, the CPI of puzzles differs almost four times: $1.11 on Android and $4.53 on iOS.The average CPI on Android increased from $0.92 in March 2020 to $2.02 in February 2021 – an increase of 120%.
- On iOS, the average installation cost also increased, but only by 47% — from $3.28 to $4.82.Liftoff notes that the rapid growth of CPI on Android may be related to the preparation of the market for Apple’s new IDFA policy.
- The company believes that Android, even though it has always been considered as a cheaper platform, now the situation is starting to change.Comparison of CPI for casual games on Android and iOS
The average ROAS of the seventh day is almost the same for Android and iOS — 10.2% versus 10.9%.
- The biggest difference is noticeable in lifestyle games (16.5% vs. 25.3%), but for puzzles, this indicator is the same for both platforms – 9.4%.Almost the same can be said about the ROAS of 30 days.
- On average, this figure is even slightly higher on Android — 30% versus 29.2% on iOS. The profitability of advertising differs the most, again, in lifestyle games — 34% on Android and 43.9% on iOS.Comparison of CPI and ROAS by region
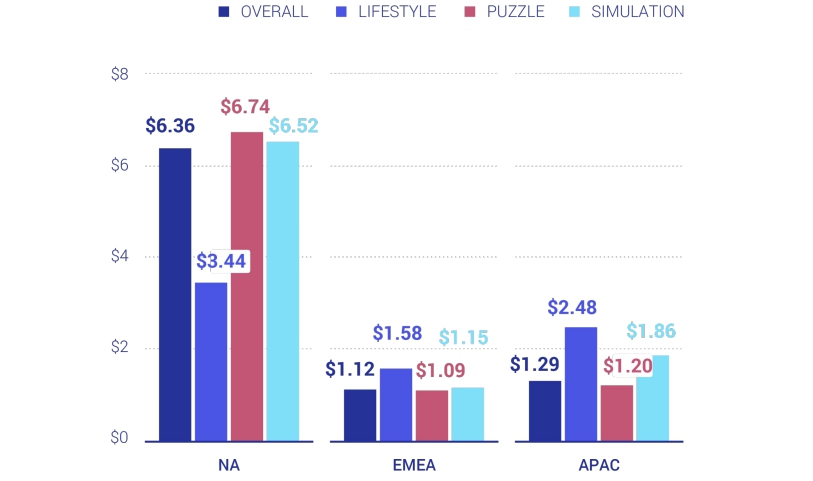
The highest price per installation in North America is $6.36 on average for all casual games.
- For comparison, in EMEA (Europe, Middle East and Africa), the average CPI is $1.12, and in the Asia-Pacific region — $1.29.But the ROAS indicators are almost identical in all regions.
- According to Liftoff, this indicates the increased interest of the audience in casual games around the world.Analysts also believe that in the face of increased competition in the casual gaming segment, companies will have to look for new markets to attract users.
- CPI for casual games in different regions


