Liftoff: the average download price of the game is $4.37, and the registration price is $9.17
Data on the cost of traffic to games, as well as its dynamics, — Liftoff marketing company shared in its large-scale research.
From the report you will learn:
- how much does the installation, registration and paying user cost on average by market (and broken down by platform);
- how does the registration price and the paying user change depending on the month;
- which countries have the most expensive gaming traffic;
- in which region paying users cost the least.
The general situation with the acquisition
Liftoff, though, notes the well-being of the mobile gaming market, but also speaks about the pampering of mobile gamers.
It is caused by the variety of offers on the market and leads to an increase in the cost of attraction and a drop in conversion.

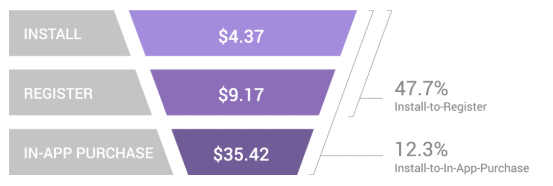
Funnel of costs for attracting users in mobile games (aggregate data) During the year, the price of installing a mobile game increased by 16.5%.
- Now it is $4.37.
- The cost of a registered user in the game increased by 33.3% to $9.17.
- To get a paying player, on average, the market has to pay $35.42.
- The conversion rate from installation to registration fell by 6.9% to 47.7%.
- The conversion rate from registration to payment fell by 1.1% to 12.3%.
The difference in the cost of traffic between Android and iOS
Liftoff analysts do not see a very big difference between the cost of attracting on Android and iOS.
The main difference between the platforms is in the conversion rate (the width of the funnel at various stages).

Funnel of costs for attracting users in mobile games (segmentation by platform)Installation on Android is still cheaper than on iOS.
- $3.21 versus $4.85.
- The cost of registration at both sites in the whole world does not differ — just above $ 9.
- The purchase of a paying player on Android is now lower. Here, a gamer will cost you $33.83 (this is 9.9% more expensive than a year earlier).
- Despite approximately the same cost of registration and paying player on both platforms, the conversion rate on iOS is much higher.
- The conversion rate from installation to registration on Android is 35.3%, and on iOS — 52.7%.
- The conversion rate from registration to payment on Android is 9.5% versus 13.2% on iOS.
Dynamics of the cost of registration and the level of conversion to it
The above metrics are market averages.
They are dynamic in nature. In particular, they change from month to month throughout the year.

Dynamics of the cost of registration and conversion from upload to registration (June 2018 — May 2019)The registration conversion rate jumps between 45% and 60% throughout the year.
- Peaks occur in December and March — during the same periods, the maximum drop in the cost of registration itself is observed.
- Liftoff writes that the best time to purchase is when the cost of registration is falling, and the conversion rate is growing. These are the periods from September to December and from February to May.
- If the team has a goal to re-attract the audience, then it is better to plan this at a time when the conversion is the lowest: from June to August and from April to May.
Dynamics of the cost of the paying user and the conversion rate to it
As with registrations, these metrics depend on the time of year.

Dynamics of the cost of the paying user and conversion from registration to payment (June 2018 — May 2019)The peak conversion to a paying user is in December — 16.2%.
- However, the period from July to September is the most interesting time for purchases, when both the price is small and the conversion values are good.
- As for the period from January to May, this is the least favorable time for advertising campaigns, since the cost is peak, and the conversion rate reaches the lowest values for the year.
The cost of installation by country
Analysts have compiled nine countries into one table, whose potential they consider to be the highest in the mobile gaming perspective.

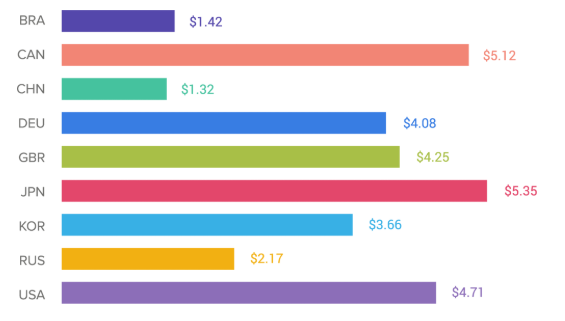
Installation cost by countryThere are no surprises here.
- The highest installation costs are in Japan ($5.35), Canada ($5.12) and the USA ($4.71).
- Separately, Russia is noted, whose cost ($ 2.17) just reflects the market average.
- Brazil also stands out. There is a low cost of traffic ($1.42), the market itself is growing very fast. However, the poverty of the population creates problems when converting users to a paying audience.
The cost of registration and the cost of the paying user, as well as conversion to them by region
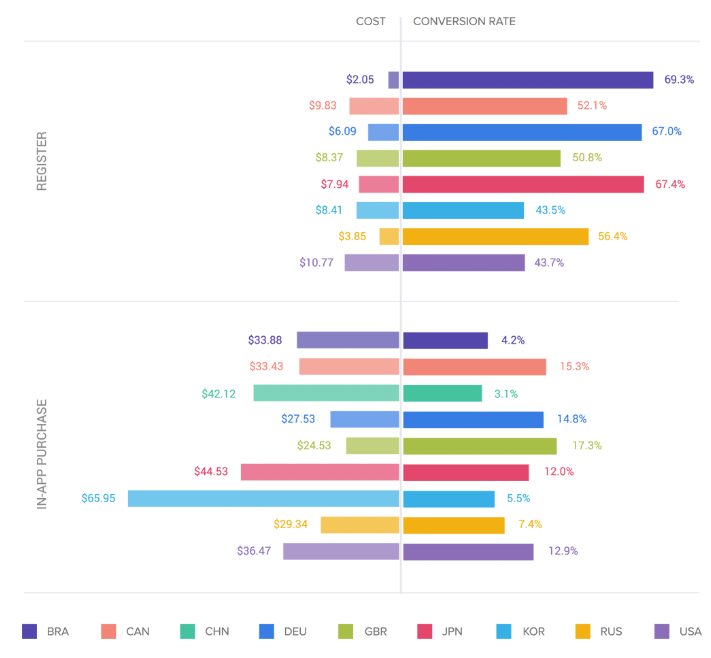
In fact, just below Liftoff has combined four tables into one.
Here is a breakdown by country of the cost of registration, conversion from installation to registration, the cost of attracting a paying user and conversion from registration to a paying user.

- The cost of registration in Brazil is one of the lowest — $ 2.05 (five times less than in the USA). At the same time, the conversion rate to a registered user here is a record — 69.3%.
- In terms of acquiring a registered user, Russia is in second place in terms of cheapness ($3.85). The conversion rate in our country is also considered very high in the market — 56.4%.
- If we talk about buying paying users, then the situation is different. The cheapest such user will cost in the UK ($ 24.53). There is also the highest conversion from registration to paying.
Methodology
The data was taken by the company from June 1, 2018 to May 31, 2019.
A total of 555 applications were processed, which generated 81.8 million downloads. 3.8 million registrations and 14 million payments were made in them during the period.
Also on the topic:
